Exotic Annual Grass
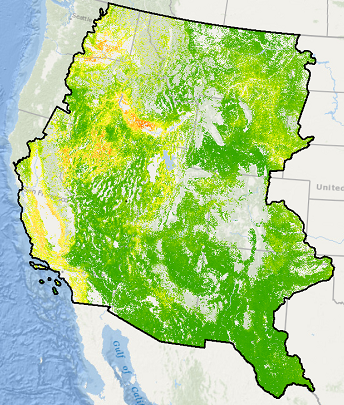
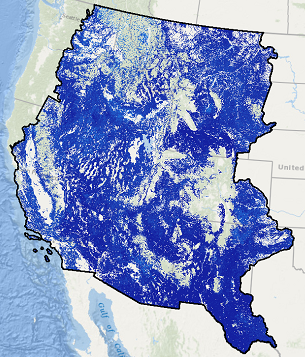
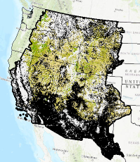
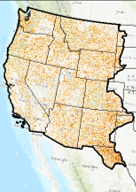
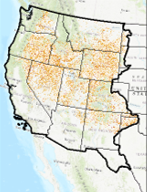
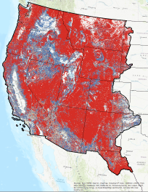
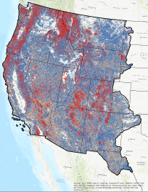
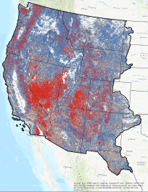
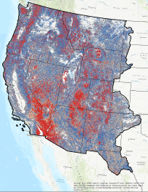
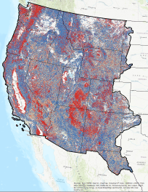
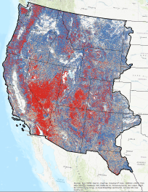
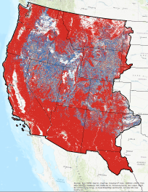
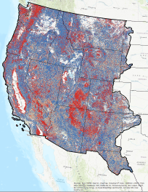
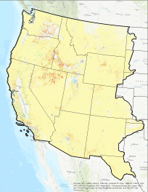
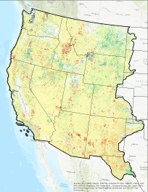
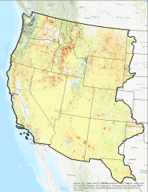
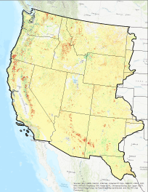
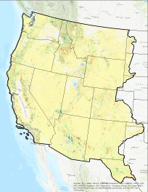
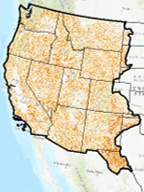
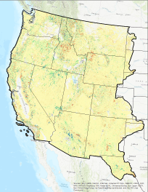
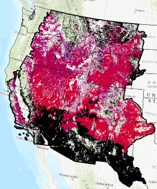
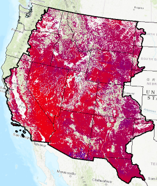
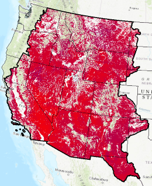
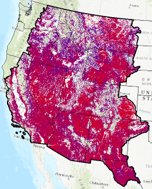
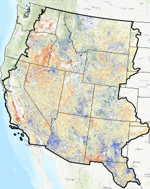
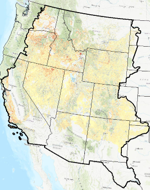
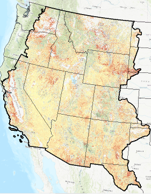
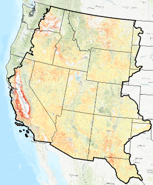
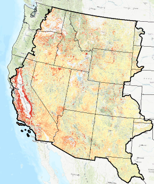
The Exotic Annual Grass (EAG) abundance dataset provides early season percent cover estimate of the exotic grass species in 30m spatial resolution for a mapped year in rangeland ecosystems of western United States. We plan to release these EAG estimates multiple times each year in early growing season. EAG is a continuous field consisting of abundance of non-native grass species whose life history is complete in one growing season. Cheatgrass (Bromus tectorum) is a dominant species, but this dataset also includes Bromus arvensis L., Bromus briziformis Fisch. & C.A. Mey. Bromus catharticus Vahl, Bromus commutatus Schrad, Bromus diandrus Roth, Bromus hordeaceus L., Bromus hordeaceus spp. Hordeaceus, Bromus japonicus Thunb, Bromus madritensis L., Bromus madritensis L. ssp. rubens (L.) Duvin, Bromus racemosus L., Bromus rubens L., Bromus secalinus L., Bromus texensis (Shear) Hitchc, and medusahead (Taeniatherum caput-medusae (L.) Nevski). A main objective of releasing these maps is to provide a tool for better monitoring EAG dynamics and informing conservation and management efforts at local to regional scales. (Read More)
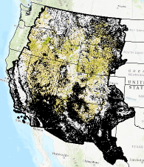
Exotic Annual Grass Confidence Level June 19th, 2023
Western U.S.
| 2023
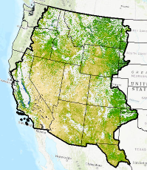
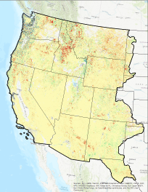
Exotic Annual Grass Percent Cover June 19th, 2023
Western U.S.
| 2023
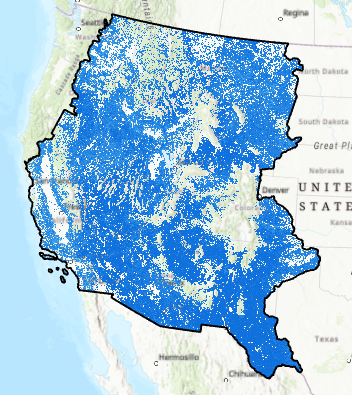
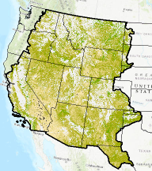
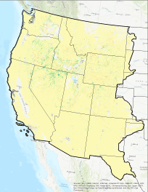
Exotic Annual Grass Confidence Level June 12th, 2023
Western U.S.
| 2023
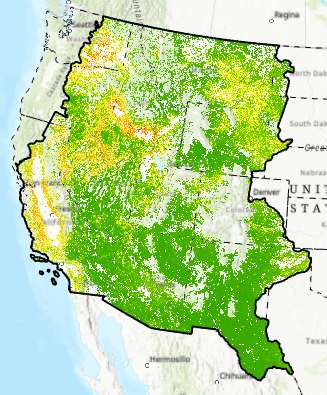
Exotic Annual Grass Percent Cover June 12th, 2023
Western U.S.
| 2023
Exotic Annual Grass Confidence Level June 5th, 2023
Western U.S.
| 2023
Exotic Annual Grass Percent Cover June 5th, 2023
Western U.S.
| 2023
Exotic Annual Grass Confidence Level May 29th, 2023
Western U.S.
| 2023
Exotic Annual Grass Percent Cover May 29th, 2023
Western U.S.
| 2023
Exotic Annual Grass Confidence Level May 22nd, 2023
Western U.S.
| 2023
Exotic Annual Grass Percent Cover May 22nd, 2023
Western U.S.
| 2023
Exotic Annual Grass Confidence Level May 15th, 2023
Western U.S.
| 2023
Exotic Annual Grass Percent Cover May 15th, 2023
Western U.S.
| 2023
Exotic Annual Grass Confidence Level May 8th, 2023
Western U.S.
| 2023
Exotic Annual Grass Percent Cover May 8th, 2023
Western U.S.
| 2023
Exotic Annual Grass Confidence Level May 1st, 2023
Western U.S.
| 2023
Exotic Annual Grass Percent Cover May 1st, 2023
Western U.S.
| 2023
Exotic Annual Grass Percent Cover - July 01, 2022
Western U.S.
| 2022
Exotic Annual Grass Confidence Level - July 01, 2022
Western U.S.
| 2022
Exotic Annual Grass Percent Cover - June 15, 2022
Western U.S.
| 2022
Exotic Annual Grass Confidence Level - June 15, 2022
Western U.S.
| 2022
Exotic Annual Grass Percent Cover - June 03, 2022
Western U.S.
| 2022
Exotic Annual Grass Confidence Level - June 03, 2022
Western U.S.
| 2022
Exotic Annual Grass Percent Cover - May 18, 2022
Western U.S.
| 2022
Exotic Annual Grass Confidence Level - May 18, 2022
Western U.S.
| 2022
Exotic Annual Grass Percent Cover - May 06, 2022
Western U.S.
| 2022
Exotic Annual Grass Confidence Level - May 06, 2022
Western U.S.
| 2022
Exotic Annual Grass Percent Cover - July 2021
Western U.S.
| 2021
Exotic Annual Grass Confidence Level - July 2021
Western U.S.
| 2021
Exotic Annual Grass Percent Cover - May 2021
Western U.S.
| 2021
Exotic Annual Grass Confidence Level - May 2021
Western U.S.
| 2021
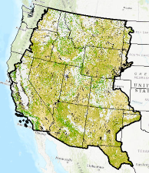
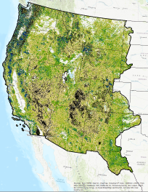
RCMAP – Basemap (2016)
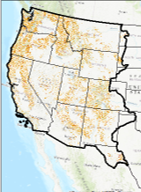
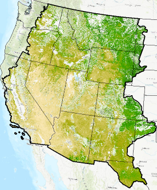
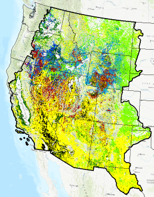
RCMAP base component products characterize the percentage of each 30-meter pixel in the Western United States covered by shrub, herbaceous, bare ground, litter, sagebrush, big sagebrush and annual herbaceous, along with estimating shrub height and sagebrush height. These products have been produced by USGS in collaboration with the Bureau of Land Management. Component products are designed to be used individually or combined to support a broad variety of applications.
Please note these new Revised (071520) rangeland products will differ from the first generation of circa 2016 fractional cover maps, a more aggressive masking of tree canopy cover was applied to each rangeland component. Specifically, we have lowered the tree canopy cover threshold for exclusion from 40 to 25%. For pixels with 1-25% tree canopy cover we ensured that our primary components (shrub, herbaceous, litter, and bare ground) cover summed to 100% when added with the tree canopy. And, for the secondary components (sagebrush, big sagebrush, sagebrush height and shrub height) we reconciled to the primary component (shrub), excluding any pinyon-juniper woodlands. (Read More)
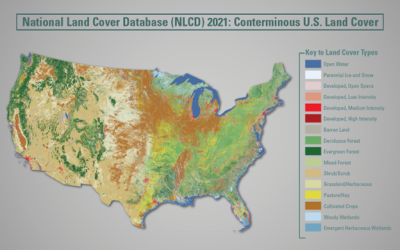
NLCD 2016 All Rangeland Cover
Western U.S.
| 2016
NLCD 2016 Bare Ground Rangeland Cover
Western U.S.
| 2016
NLCD 2016 Big Sagebrush Rangeland Cover
Western U.S.
| 2016
NLCD 2016 Annual Herbaceous Rangeland Cover
Western U.S.
| 2016
NLCD 2016 Herbaceous Rangeland Cover
Western U.S.
| 2016
NLCD 2016 Litter Rangeland Cover
Western U.S.
| 2016
NLCD 2016 Sagebrush Rangeland Cover
Western U.S.
| 2016
NLCD 2016 Sagebrush Height Rangeland Cover
Western U.S.
| 2016
NLCD 2016 Shrub Rangeland Cover
Western U.S.
| 2016
NLCD 2016 Shrub Height Rangeland Cover
Western U.S.
| 2016
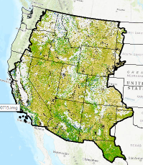
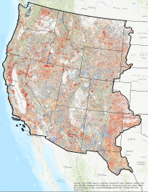
RCMAP - Time-Series - Trends
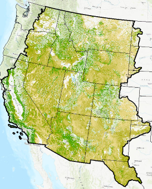
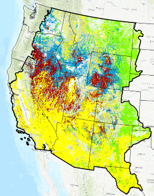
The RCMAP product suite includes 10 components: annual herbaceous, bare ground, herbaceous, litter, non-sagebrush shrub, perennial herbaceous, sagebrush, shrub, tree, and shrub height. Data characterize the percentage of each 30-meter pixel in the Western United States covered by each component for each year from 1985-2023 - providing change information for 39 years. (Read More)
Break Point Presence/Absence in Each Year Annual Herbaceous
Western U.S.
| Time Series Trends
Break Point Presence/Absence in Each Year Bare Ground
Western U.S.
| Time Series Trends
Break Point Presence/Absence in Each Year Herbaceous
Western U.S.
| Time Series Trends
Break Point Presence/Absence in Each Year Litter
Western U.S.
| Time Series Trends
Break Point Presence/Absence in Each Year Non Sagebrush Shrub
Western U.S.
| Time Series Trends
Break Point Presence/Absence in Each Year Perennial Herbaceous
Western U.S.
| Time Series Trends
Slope of Segment in Each Year Shrub
Western U.S.
| Time Series Trends
Break Point Presence/Absence in Each Year Sagebrush
Western U.S.
| Time Series Trends
Break Point Presence/Absence in Each Year Shrub
Western U.S.
| Time Series Trends
Break Point Presence/Absence in Each Year Tree
Western U.S.
| Time Series Trends
Break Point Count
Western U.S.
| Time Series Trends
P-Value of Segment in Each Year Annual Herbaceous
Western U.S.
| Time Series Trends
P-Value of Segment in Each Year Bare Ground
Western U.S.
| Time Series Trends
P-Value of Segment in Each Year Herbaceous
Western U.S.
| Time Series Trends
P-Value of Segment in Each Year Litter
Western U.S.
| Time Series Trends
P-Value of Segment in Each Year Non Sagebrush Shrub
Western U.S.
| Time Series Trends
P-Value of Segment in Each Year Perennial Herbaceous
Western U.S.
| Time Series Trends
P-Value of Segment in Each Year Sagebrush
Western U.S.
| Time Series Trends
P-Value of Segment in Each Year Shrub
Western U.S.
| Time Series Trends
P-Value of Segment in Each Year Tree
Western U.S.
| Time Series Trends
P-Value of Linear Model
Western U.S.
| Time Series Trends
Slope of Linear Model
Western U.S.
| Time Series Trends
Slope of Segment in Each Year Annual Herbaceous
Western U.S.
| Time Series Trends
Slope of Segment in Each Year Bare Ground
Western U.S.
| Time Series Trends
Slope of Segment in Each Year Herbaceous
Western U.S.
| Time Series Trends
Slope of Segment in Each Year Litter
Western U.S.
| Time Series Trends
Slope of Segment in Each Year Non Sagebrush Shrub
Western U.S.
| Time Series Trends
Slope of Segment in Each Year Perennial Herbaceous
Western U.S.
| Time Series Trends
Slope of Segment in Each Year Sagebrush
Western U.S.
| Time Series Trends
Slope of Segment in Each Year Tree
Western U.S.
| Time Series Trends
Total Change Intensity Index
Western U.S.
| Time Series Trends
Year of Most Recent Break
Western U.S.
| Time Series Trends
Break Point Presence/Absence in Each Year Shrub Height
Western U.S.
| Time Series Trends
Slope of Segment in Each Year Shrub Height
Western U.S.
| Time Series Trends
P-Value of Segment in Each Year Shrub Height
Western U.S.
| Time Series Trends
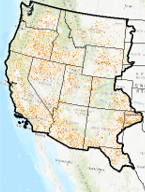
Ecological Potential
Rangeland Ecological Potential - Component Cover, Cover Departure, and Vegetation States.
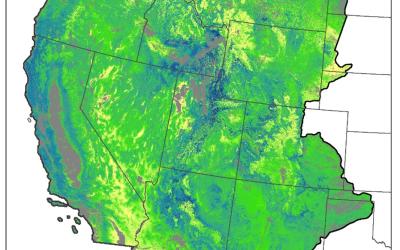
Ecological Potential rangeland fractional cover data products represent the potential cover given the most productive, least disturbed, portion of the 1985-2020 Landsat archive. Models used to predict Ecological Potential cover were trained on ecologically intact sites where annual herbaceous cover is low, no known disturbance or land treatment has occurred over the study period, and bare ground cover is relatively lower than expectations (Read More)
Ecological Potential Bare Ground Cover
Western U.S.
Ecological Potential Sagebrush Cover
Western U.S.
Ecological Potential Perennial Herbaceous Cover
Western U.S.
Ecological Potential Litter Cover
Western U.S.
Ecological Potential Shrub Cover
Western U.S.
Percent Error for Ecological Potential Bare Ground
Western U.S.
Percent Error for Ecological Potential Sagebrush
Western U.S.
Percent Error for Ecological Potential Perennial Herbaceous
Western U.S.
Percent Error for Ecological Potential Litter
Western U.S.
Percent Error for Ecological Potential Shrub
Western U.S.
Departure of Bare Ground Cover
Western U.S.
Departure of Sagebrush Cover
Western U.S.
Departure of Perennial Herbaceous Cover
Western U.S.
Departure of Litter Cover
Western U.S.
Departure of Shrub Cover
Western U.S.
Ecological Potential Vegetation State
Western U.S.
2018 Vegetation State
Western U.S.