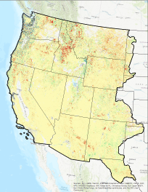
Land Cover
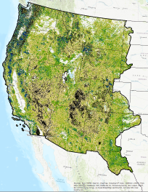
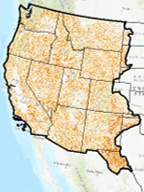
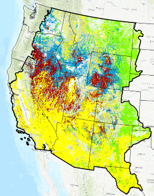
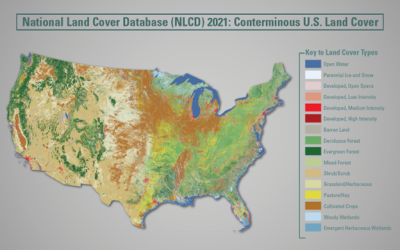
The National Land Cover Database (NLCD) provides nationwide data on land cover and land cover change at a 30m resolution with a 16-class legend based on a modified Anderson Level II classification system. NLCD 2021 represents the latest evolution of NLCD land cover products focused on providing innovative land cover and land cover change data for the Nation. NLCD 2021 offers 9 integrated epochs of land cover for years 2001, 2004, 2006, 2008, 2011, 2013, 2016, 2019, and 2021. chs (2001 – 2021) and are directly comparable across the full time series and suitable for multi-temporal analysis. The NLCD 2021 release is update based, so the Land Cover and Impervious Surface products released in 2019 are unchanged and can be used directly with NLCD 2021. Science products and the change index will need to be reacquired to contain the additional 2021 change. Specific map products include:Developed classes in these years are directly derived from percent developed impervious surface and include a descriptor label that identifies the type of each impervious surface pixel. The NLCD Land Cover change index combines information from all years of land cover change and provides a simple and comprehensive way to visualize change from all 9 dates of land cover in a single layer. The change index was designed to assist NLCD users to understand complex land cover change with a single product. NLCD 2021 does not yet contain updated products for Alaska, Hawaii and Puerto Rico. (Read More)
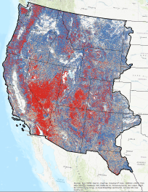
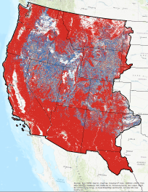
NLCD Land Cover Change Index (CONUS)
CONUS
| 2021, 2019, 2016, 2013, 2011, 2008, 2006, 2004, 2001
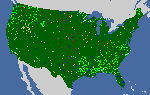
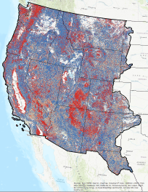
NLCD Land Cover (CONUS) All Years
CONUS
| 2021, 2019, 2016, 2013, 2011, 2008, 2006, 2004, 2001
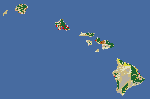
NOAA 2011 High Resolution Land Cover (HAWAII)
Islands & Territories
| 2011
NOAA 2005 to 2011 High Resolution Land Cover Change (HAWAII)
Islands & Territories
| 2005, 2011
NOAA 2005 Land Cover (HAWAII)
Islands & Territories
| 2005
NOAA 2001 to 2005 Land Cover Change (HAWAII)
Islands & Territories
| 2001, 2005
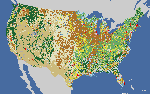
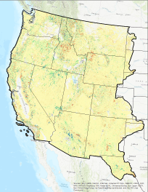
NLCD 2021 Land Cover (CONUS)
CONUS
| 2021
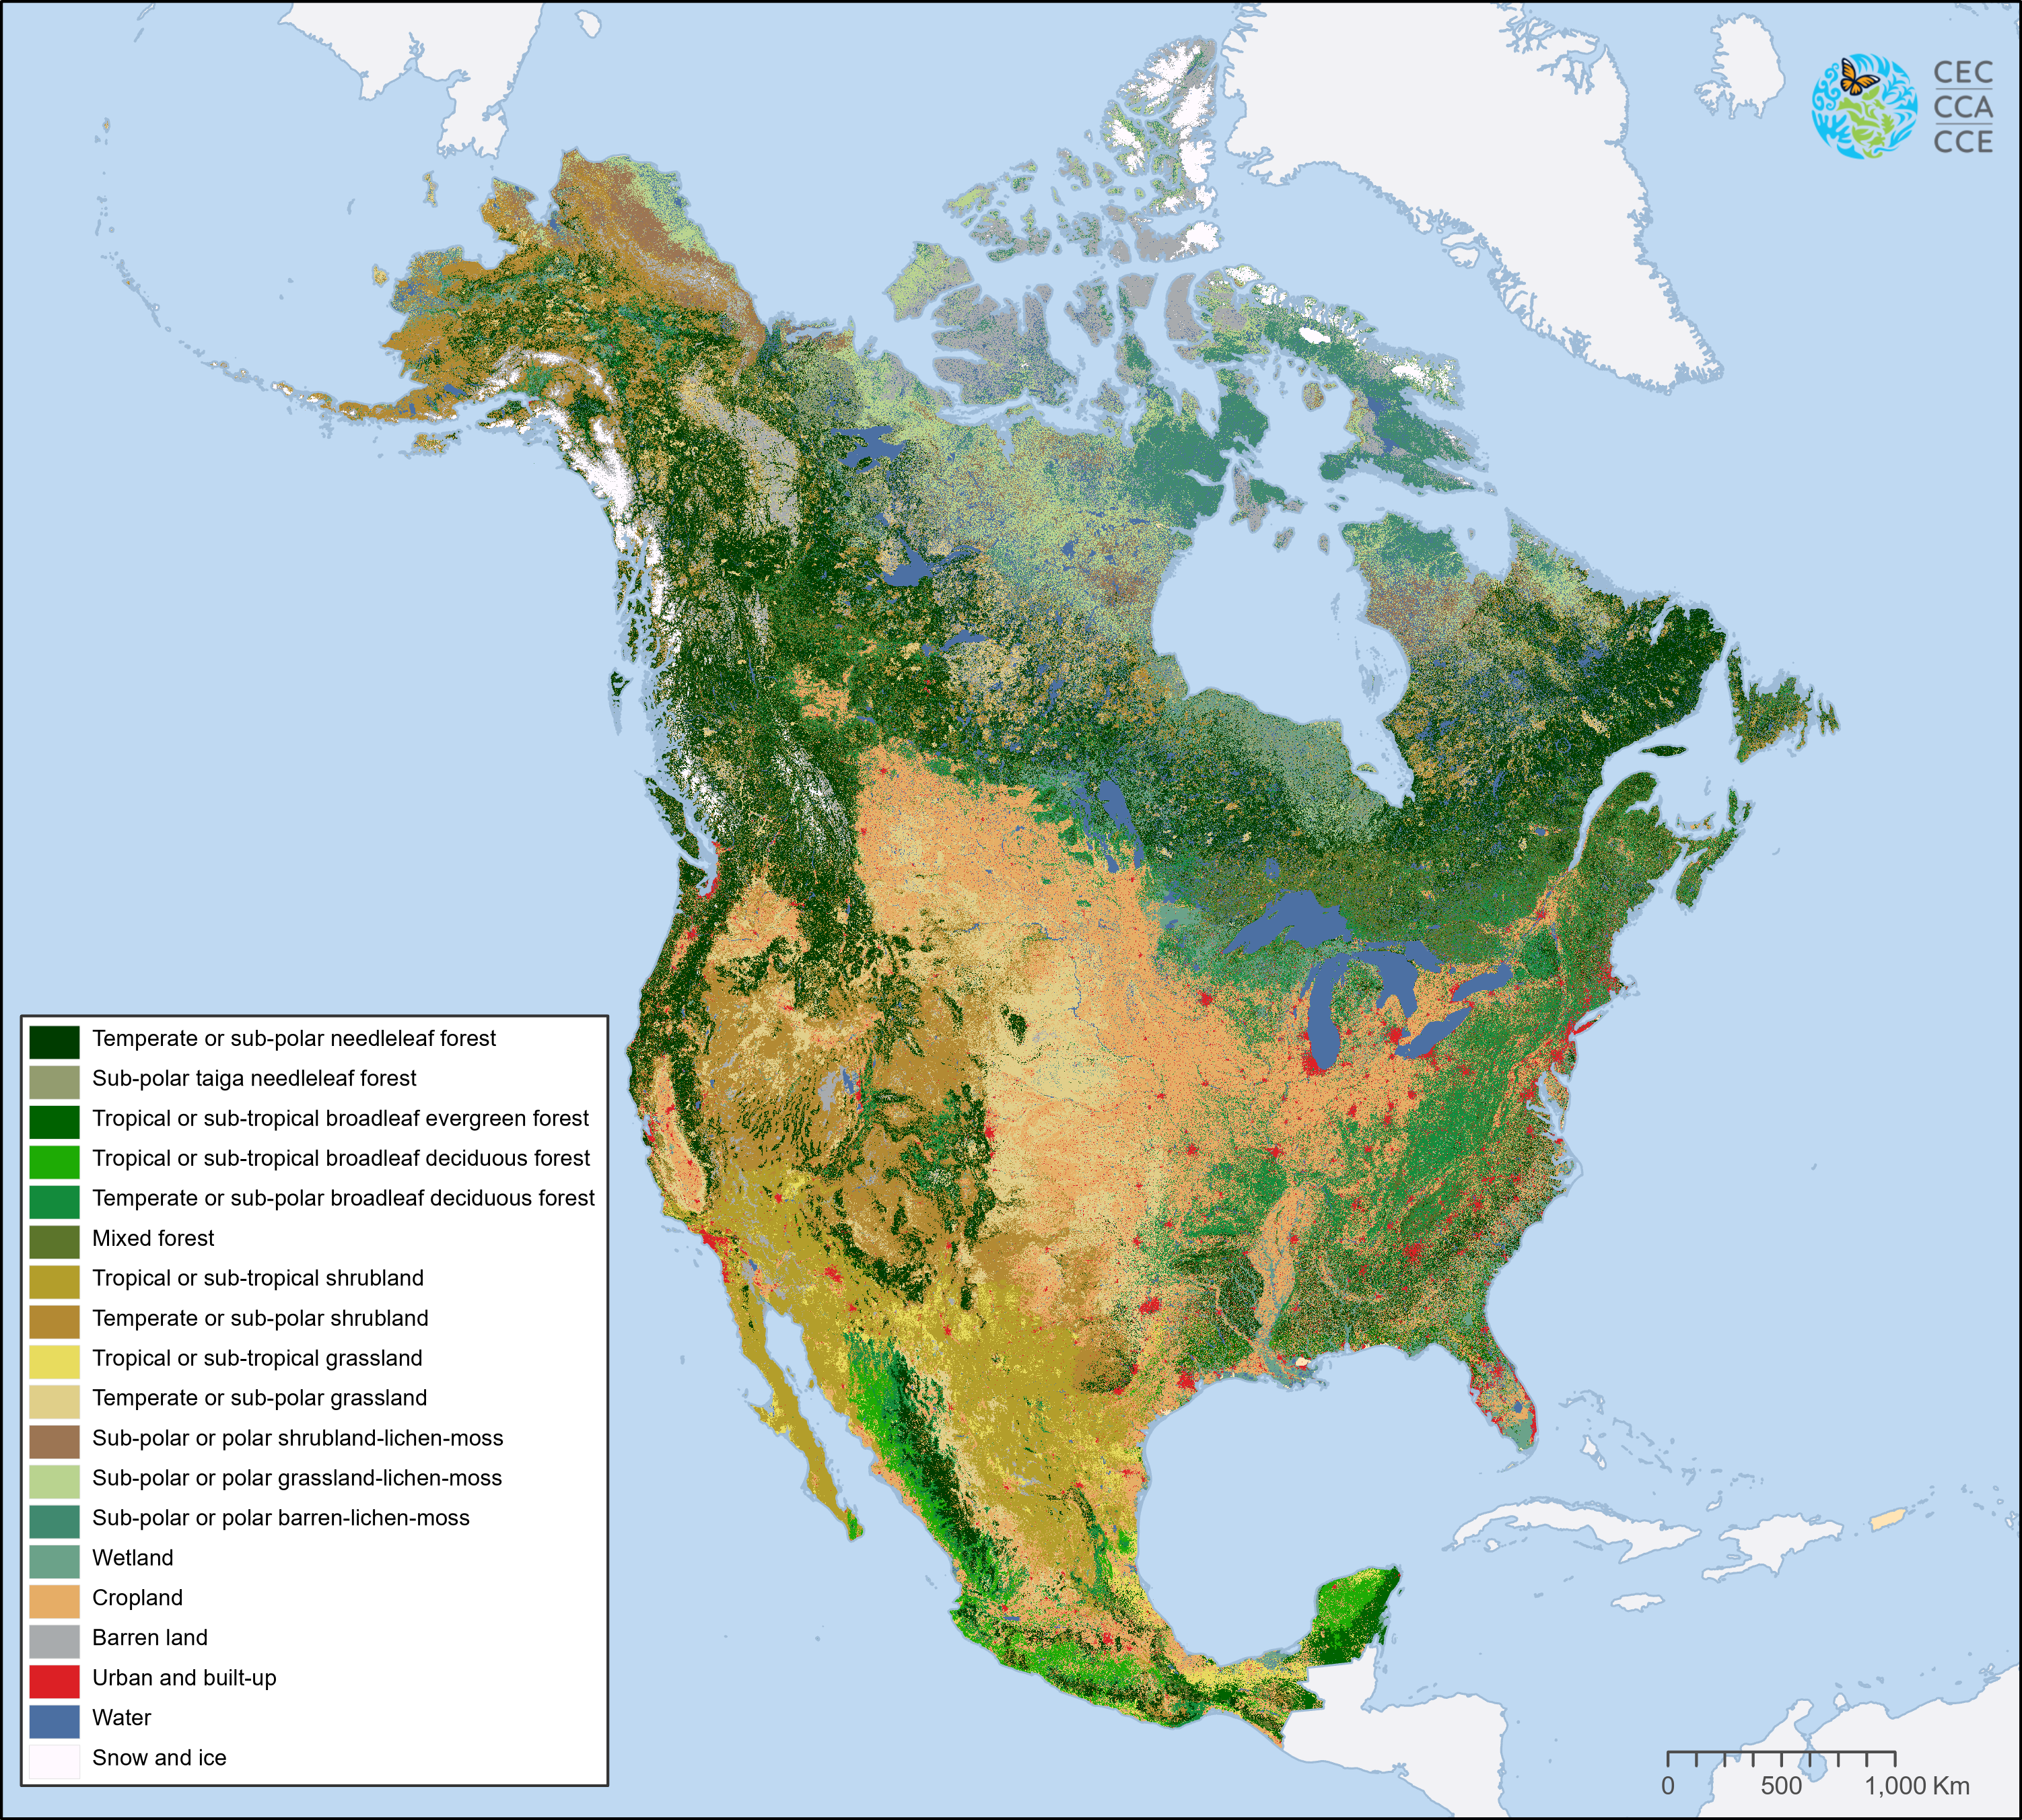
North American Land Change Monitoring System
North America
| 2020
NLCD 2019 Land Cover (CONUS)
CONUS
| 2019
NLCD 2016 Land Cover (CONUS)
CONUS
| 2016
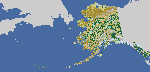
NLCD 2016 Land Cover (ALASKA)
Alaska
| 2016
NLCD 2013 Land Cover (CONUS)
CONUS
| 2013
NLCD 2011 Land Cover (CONUS)
CONUS
| 2011
NLCD 2011 Land Cover (ALASKA)
Alaska
| 2011
NLCD 2011 to 2016 Land Cover Change (ALASKA)
Alaska
| 2011, 2016
NLCD 2011 from-to 2016 Land Cover Change Pixels (ALASKA)
Alaska
| 2011, 2016
NLCD 2008 Land Cover (CONUS)
CONUS
| 2008
NLCD 2006 Land Cover (CONUS)
CONUS
| 2006
NLCD 2004 Land Cover (CONUS)
CONUS
| 2004
NLCD 2001 Land Cover (CONUS)
CONUS
| 2001
NLCD 2001 to 2011 Land Cover Change (ALASKA)
Alaska
| 2001, 2011
NLCD 2001 from-to 2011 Land Cover Change Pixels (ALASKA)
Alaska
| 2001, 2011
NLCD 2001 Land Cover (ALASKA)
Alaska
| 2001
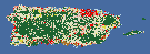
NLCD 2001 Land Cover (PUERTO RICO)
Islands & Territories
| 2001
NLCD 2001 Land Cover (HAWAII)
Islands & Territories
| 2001
NLCD 2001 to 2016 Land Cover Change (ALASKA)
Alaska
| 2001, 2016
NLCD 2001 from-to 2016 Land Cover Change Pixels (ALASKA)
Alaska
| 2001, 2016
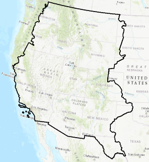
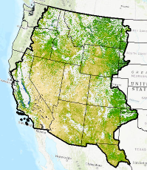
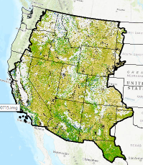
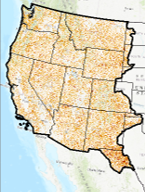
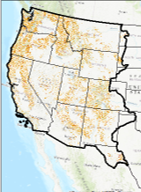
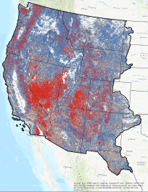
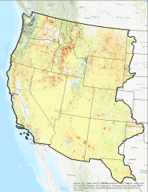
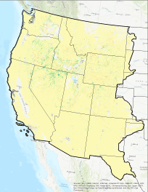
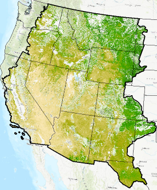
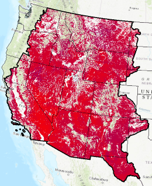
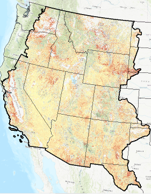
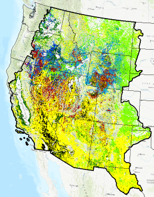
RCMAP – Basemap (2016)
RCMAP base component products characterize the percentage of each 30-meter pixel in the Western United States covered by shrub, herbaceous, bare ground, litter, sagebrush, big sagebrush and annual herbaceous, along with estimating shrub height and sagebrush height. These products have been produced by USGS in collaboration with the Bureau of Land Management. Component products are designed to be used individually or combined to support a broad variety of applications.
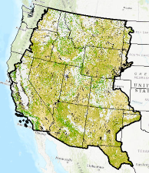
Please note these new Revised (071520) rangeland products will differ from the first generation of circa 2016 fractional cover maps, a more aggressive masking of tree canopy cover was applied to each rangeland component. Specifically, we have lowered the tree canopy cover threshold for exclusion from 40 to 25%. For pixels with 1-25% tree canopy cover we ensured that our primary components (shrub, herbaceous, litter, and bare ground) cover summed to 100% when added with the tree canopy. And, for the secondary components (sagebrush, big sagebrush, sagebrush height and shrub height) we reconciled to the primary component (shrub), excluding any pinyon-juniper woodlands. (Read More)
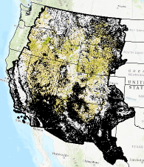
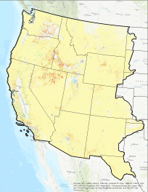
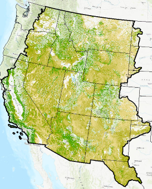
NLCD 2016 All Rangeland Cover
Western U.S.
| 2016
NLCD 2016 Bare Ground Rangeland Cover
Western U.S.
| 2016
NLCD 2016 Big Sagebrush Rangeland Cover
Western U.S.
| 2016
NLCD 2016 Annual Herbaceous Rangeland Cover
Western U.S.
| 2016
NLCD 2016 Herbaceous Rangeland Cover
Western U.S.
| 2016
NLCD 2016 Litter Rangeland Cover
Western U.S.
| 2016
NLCD 2016 Sagebrush Rangeland Cover
Western U.S.
| 2016
NLCD 2016 Sagebrush Height Rangeland Cover
Western U.S.
| 2016
NLCD 2016 Shrub Rangeland Cover
Western U.S.
| 2016
NLCD 2016 Shrub Height Rangeland Cover
Western U.S.
| 2016
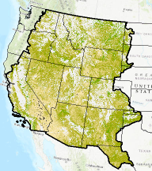
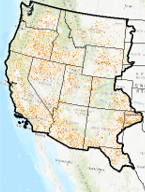
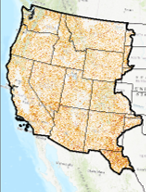
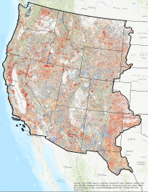
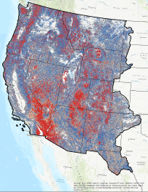
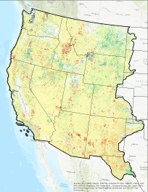
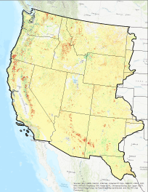
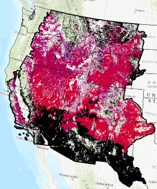
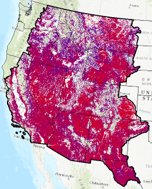
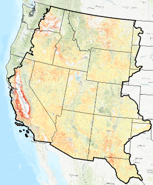
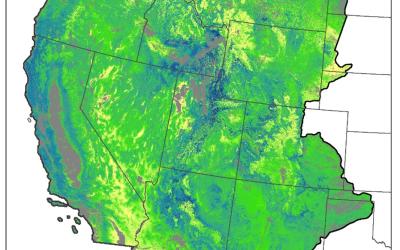
RCMAP - Time-Series - Trends
The RCMAP product suite includes 10 components: annual herbaceous, bare ground, herbaceous, litter, non-sagebrush shrub, perennial herbaceous, sagebrush, shrub, tree, and shrub height. Data characterize the percentage of each 30-meter pixel in the Western United States covered by each component for each year from 1985-2023 - providing change information for 39 years. (Read More)
Break Point Presence/Absence in Each Year Annual Herbaceous
Western U.S.
| Time Series Trends
Break Point Presence/Absence in Each Year Bare Ground
Western U.S.
| Time Series Trends
Break Point Presence/Absence in Each Year Herbaceous
Western U.S.
| Time Series Trends
Break Point Presence/Absence in Each Year Litter
Western U.S.
| Time Series Trends
Break Point Presence/Absence in Each Year Non Sagebrush Shrub
Western U.S.
| Time Series Trends
Break Point Presence/Absence in Each Year Perennial Herbaceous
Western U.S.
| Time Series Trends
Slope of Segment in Each Year Shrub
Western U.S.
| Time Series Trends
Break Point Presence/Absence in Each Year Sagebrush
Western U.S.
| Time Series Trends
Break Point Presence/Absence in Each Year Shrub
Western U.S.
| Time Series Trends
Break Point Presence/Absence in Each Year Tree
Western U.S.
| Time Series Trends
Break Point Count
Western U.S.
| Time Series Trends
P-Value of Segment in Each Year Annual Herbaceous
Western U.S.
| Time Series Trends
P-Value of Segment in Each Year Bare Ground
Western U.S.
| Time Series Trends
P-Value of Segment in Each Year Herbaceous
Western U.S.
| Time Series Trends
P-Value of Segment in Each Year Litter
Western U.S.
| Time Series Trends
P-Value of Segment in Each Year Non Sagebrush Shrub
Western U.S.
| Time Series Trends
P-Value of Segment in Each Year Perennial Herbaceous
Western U.S.
| Time Series Trends
P-Value of Segment in Each Year Sagebrush
Western U.S.
| Time Series Trends
P-Value of Segment in Each Year Shrub
Western U.S.
| Time Series Trends
P-Value of Segment in Each Year Tree
Western U.S.
| Time Series Trends
P-Value of Linear Model
Western U.S.
| Time Series Trends
Slope of Linear Model
Western U.S.
| Time Series Trends
Slope of Segment in Each Year Annual Herbaceous
Western U.S.
| Time Series Trends
Slope of Segment in Each Year Bare Ground
Western U.S.
| Time Series Trends
Slope of Segment in Each Year Herbaceous
Western U.S.
| Time Series Trends
Slope of Segment in Each Year Litter
Western U.S.
| Time Series Trends
Slope of Segment in Each Year Non Sagebrush Shrub
Western U.S.
| Time Series Trends
Slope of Segment in Each Year Perennial Herbaceous
Western U.S.
| Time Series Trends
Slope of Segment in Each Year Sagebrush
Western U.S.
| Time Series Trends
Slope of Segment in Each Year Tree
Western U.S.
| Time Series Trends
Total Change Intensity Index
Western U.S.
| Time Series Trends
Year of Most Recent Break
Western U.S.
| Time Series Trends
Break Point Presence/Absence in Each Year Shrub Height
Western U.S.
| Time Series Trends
Slope of Segment in Each Year Shrub Height
Western U.S.
| Time Series Trends
P-Value of Segment in Each Year Shrub Height
Western U.S.
| Time Series Trends
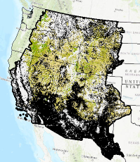
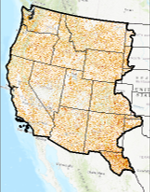
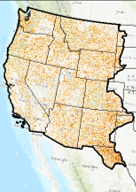
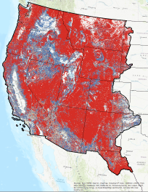
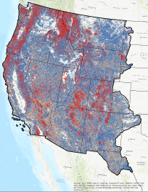
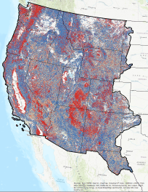
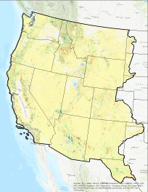
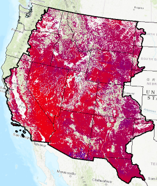
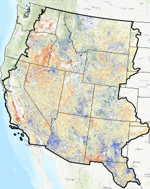
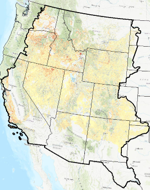
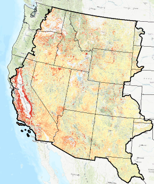
Ecological Potential
Rangeland Ecological Potential - Component Cover, Cover Departure, and Vegetation States.
Ecological Potential rangeland fractional cover data products represent the potential cover given the most productive, least disturbed, portion of the 1985-2020 Landsat archive. Models used to predict Ecological Potential cover were trained on ecologically intact sites where annual herbaceous cover is low, no known disturbance or land treatment has occurred over the study period, and bare ground cover is relatively lower than expectations (Read More)
Ecological Potential Bare Ground Cover
Western U.S.
Ecological Potential Sagebrush Cover
Western U.S.
Ecological Potential Perennial Herbaceous Cover
Western U.S.
Ecological Potential Litter Cover
Western U.S.
Ecological Potential Shrub Cover
Western U.S.
Percent Error for Ecological Potential Bare Ground
Western U.S.
Percent Error for Ecological Potential Sagebrush
Western U.S.
Percent Error for Ecological Potential Perennial Herbaceous
Western U.S.
Percent Error for Ecological Potential Litter
Western U.S.
Percent Error for Ecological Potential Shrub
Western U.S.
Departure of Bare Ground Cover
Western U.S.
Departure of Sagebrush Cover
Western U.S.
Departure of Perennial Herbaceous Cover
Western U.S.
Departure of Litter Cover
Western U.S.
Departure of Shrub Cover
Western U.S.
Ecological Potential Vegetation State
Western U.S.
2018 Vegetation State
Western U.S.