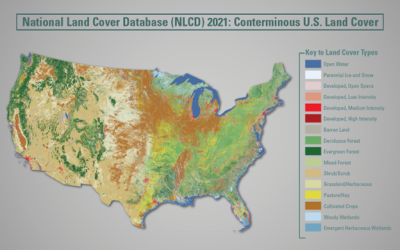
Urban Imperviousness
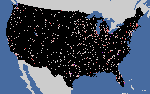
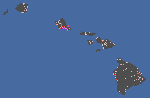
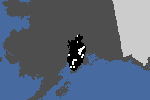
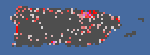
NLCD imperviousness products represent urban impervious surfaces as a percentage of developed surface over every 30-meter pixel in the United States. The NLCD 2021 release is update based, so the Impervious Surface products released in 2019 are unchanged and can be used directly with NLCD 2021.This update provides integrated analysis throughout all dates and includes a matching impervious surface descriptor layer. This descriptor layer identifies types of roads, wind tower sites, building locations, and energy production sites to allow a deeper analysis of developed features. No new imperviousness products for Alaska, Hawaii and Puerto Rico are available for NLCD 2021. (Read More)
NLCD Imperviousness (CONUS) All Years
CONUS
| 2021, 2019, 2016, 2013, 2011, 2008, 2006, 2004, 2001
NLCD 2019 Percent Developed Imperviousness (CONUS)
CONUS
| 2019
NLCD 2019 Developed Imperviousness Descriptor (CONUS)
CONUS
| 2019
NLCD 2016 Percent Developed Imperviousness (CONUS)
CONUS
| 2016
NLCD 2016 Developed Imperviousness Descriptor (CONUS)
CONUS
| 2016
NLCD 2011 Percent Developed Imperviousness (CONUS)
CONUS
| 2011
NLCD 2011 Percent Developed Imperviousness Zone 8 (ALASKA)
Alaska
| 2011
NLCD 2011 Developed Imperviousness Descriptor (CONUS)
CONUS
| 2011
NLCD 2006 Percent Developed Imperviousness (CONUS)
CONUS
| 2006
NLCD 2006 Developed Imperviousness Descriptor (CONUS)
CONUS
| 2006
NLCD 2001 Percent Developed Imperviousness (CONUS)
CONUS
| 2001
NLCD 2001 Developed Imperviousness Descriptor (CONUS)
CONUS
| 2001
NLCD 2001 to 2011 Developed Imperviousness Zone 8 Change (ALASKA)
Alaska
| 2001, 2011
NLCD 2001 Percent Developed Imperviousness Zone 8 (ALASKA)
Alaska
| 2001
NLCD 2001 Percent Developed Impervious (HAWAII)
Islands & Territories
| 2001
NLCD 2021 Developed Imperviousness Descriptor (CONUS)
CONUS
| 2021
NLCD 2021 Percent Developed Imperviousness (CONUS)
CONUS
| 2021
NLCD 2016 Percent Developed Imperviousness Zone 8 (ALASKA)
Alaska
| 2016
NLCD 2016 Developed Impervious Descriptor Zone 8 (ALASKA)
Alaska
| 2016
NLCD 2016 Developed Urban Descriptor (ALASKA)
Alaska
| 2016
NLCD 2013 Developed Imperviousness (CONUS)
CONUS
| 2013
NLCD 2013 Developed Imperviousness Descriptor (CONUS)
CONUS
| 2013
NLCD 2011 to 2016 Developed Imperviousness Zone 8 Change (ALASKA)
Alaska
| 2011, 2016
NLCD 2011 Developed Impervious Descriptor Zone 8 (ALASKA)
Alaska
| 2011
NLCD 2011 Developed Urban Descriptor (ALASKA)
Alaska
| 2011
NLCD 2008 Percent Developed Imperviousness (CONUS)
CONUS
| 2008
NLCD 2008 Developed Imperviousness Descriptor (CONUS)
CONUS
| 2008
NLCD 2004 Percent Developed Imperviousness (CONUS)
CONUS
| 2004
NLCD 2004 Developed Imperviousness Descriptor (CONUS)
CONUS
| 2004
NLCD 2001 Percent Developed Imperviousness (PUERTO RICO)
Islands & Territories
| 2001
NLCD 2001 to 2016 Developed Imperviousness Zone 8 Change (ALASKA)
Alaska
| 2001, 2016
NLCD 2001 Developed Impervious Descriptor Zone 8 (ALASKA)
Alaska
| 2001
NLCD 2001 Developed Urban Descriptor (ALASKA)
Alaska
| 2001
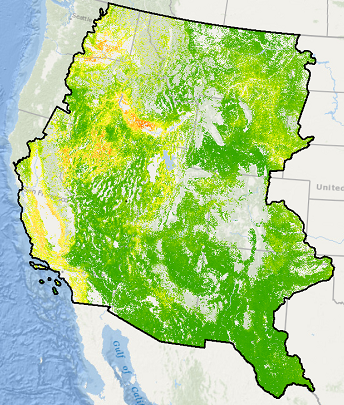
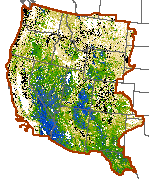
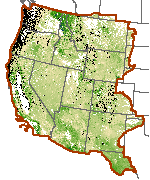
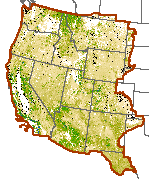
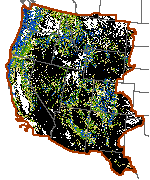
Exotic Annual Grass
The Exotic Annual Grass (EAG) abundance dataset provides early season percent cover estimate of the exotic grass species in 30m spatial resolution for a mapped year in rangeland ecosystems of western United States. We plan to release these EAG estimates multiple times each year in early growing season. EAG is a continuous field consisting of abundance of non-native grass species whose life history is complete in one growing season. Cheatgrass (Bromus tectorum) is a dominant species, but this dataset also includes Bromus arvensis L., Bromus briziformis Fisch. & C.A. Mey. Bromus catharticus Vahl, Bromus commutatus Schrad, Bromus diandrus Roth, Bromus hordeaceus L., Bromus hordeaceus spp. Hordeaceus, Bromus japonicus Thunb, Bromus madritensis L., Bromus madritensis L. ssp. rubens (L.) Duvin, Bromus racemosus L., Bromus rubens L., Bromus secalinus L., Bromus texensis (Shear) Hitchc, and medusahead (Taeniatherum caput-medusae (L.) Nevski). A main objective of releasing these maps is to provide a tool for better monitoring EAG dynamics and informing conservation and management efforts at local to regional scales. (Read More)
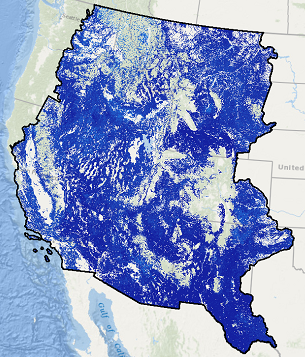
Exotic Annual Grass Confidence Level June 19th, 2023
Western U.S.
| 2023
Exotic Annual Grass Percent Cover June 19th, 2023
Western U.S.
| 2023
Exotic Annual Grass Confidence Level June 12th, 2023
Western U.S.
| 2023
Exotic Annual Grass Percent Cover June 12th, 2023
Western U.S.
| 2023
Exotic Annual Grass Confidence Level June 5th, 2023
Western U.S.
| 2023
Exotic Annual Grass Percent Cover June 5th, 2023
Western U.S.
| 2023
Exotic Annual Grass Confidence Level May 29th, 2023
Western U.S.
| 2023
Exotic Annual Grass Percent Cover May 29th, 2023
Western U.S.
| 2023
Exotic Annual Grass Confidence Level May 22nd, 2023
Western U.S.
| 2023
Exotic Annual Grass Percent Cover May 22nd, 2023
Western U.S.
| 2023
Exotic Annual Grass Confidence Level May 15th, 2023
Western U.S.
| 2023
Exotic Annual Grass Percent Cover May 15th, 2023
Western U.S.
| 2023
Exotic Annual Grass Confidence Level May 8th, 2023
Western U.S.
| 2023
Exotic Annual Grass Percent Cover May 8th, 2023
Western U.S.
| 2023
Exotic Annual Grass Confidence Level May 1st, 2023
Western U.S.
| 2023
Exotic Annual Grass Percent Cover May 1st, 2023
Western U.S.
| 2023
Exotic Annual Grass Percent Cover - July 01, 2022
Western U.S.
| 2022
Exotic Annual Grass Confidence Level - July 01, 2022
Western U.S.
| 2022
Exotic Annual Grass Percent Cover - June 15, 2022
Western U.S.
| 2022
Exotic Annual Grass Confidence Level - June 15, 2022
Western U.S.
| 2022
Exotic Annual Grass Percent Cover - June 03, 2022
Western U.S.
| 2022
Exotic Annual Grass Confidence Level - June 03, 2022
Western U.S.
| 2022
Exotic Annual Grass Percent Cover - May 18, 2022
Western U.S.
| 2022
Exotic Annual Grass Confidence Level - May 18, 2022
Western U.S.
| 2022
Exotic Annual Grass Percent Cover - May 06, 2022
Western U.S.
| 2022
Exotic Annual Grass Confidence Level - May 06, 2022
Western U.S.
| 2022
Exotic Annual Grass Percent Cover - July 2021
Western U.S.
| 2021
Exotic Annual Grass Confidence Level - July 2021
Western U.S.
| 2021
Exotic Annual Grass Percent Cover - May 2021
Western U.S.
| 2021
Exotic Annual Grass Confidence Level - May 2021
Western U.S.
| 2021
Tree Canopy
NLCD tree canopy cover geospatial datasets with spatial resolutions of 30 m are produced by the USDA Forest Service. Tree canopy cover is derived from multi-spectral satellite imagery and other available ground and ancillary information. Tree canopy products for the period 2011-2021 are available for the conterminous United States, and by summer 2023, they will also cover coastal south east Alaska, Hawaii, Puerto Rico, and U.S. Virgin Islands. (Read More)
NLCD 2021 USFS Tree Canopy Cover (CONUS)
CONUS
| 2021
NLCD 2021 USFS Tree Canopy Cover (HAWAII)
Islands & Territories
| 2021
NLCD 2021 USFS Tree Canopy Cover (ALASKA)
Alaska
| 2021
NLCD 2021 USFS Tree Canopy Cover (PUERTO RICO & U.S. VIRGIN ISLANDS)
Islands & Territories
| 2021
NLCD 2020 USFS Tree Canopy Cover (CONUS)
CONUS
| 2020
NLCD 2020 USFS Tree Canopy Cover (HAWAII)
Islands & Territories
| 2020
NLCD 2020 USFS Tree Canopy Cover (ALASKA)
Alaska
| 2020
NLCD 2020 USFS Tree Canopy Cover (PUERTO RICO & U.S. VIRGIN ISLANDS)
Islands & Territories
| 2020
NLCD 2019 USFS Tree Canopy Cover (CONUS)
CONUS
| 2019
NLCD 2019 USFS Tree Canopy Cover (HAWAII)
Islands & Territories
| 2019
NLCD 2019 USFS Tree Canopy Cover (ALASKA)
Alaska
| 2019
NLCD 2019 USFS Tree Canopy Cover (PUERTO RICO & U.S. VIRGIN ISLANDS)
Islands & Territories
| 2019
NLCD 2018 USFS Tree Canopy Cover (CONUS)
CONUS
| 2018
NLCD 2018 USFS Tree Canopy Cover (HAWAII)
Islands & Territories
| 2018
NLCD 2018 USFS Tree Canopy Cover (ALASKA)
Alaska
| 2018
NLCD 2018 USFS Tree Canopy Cover (PUERTO RICO & U.S. VIRGIN ISLANDS)
Islands & Territories
| 2018
NLCD 2017 USFS Tree Canopy Cover (CONUS)
CONUS
| 2017
NLCD 2017 USFS Tree Canopy Cover (HAWAII)
Islands & Territories
| 2017
NLCD 2017 USFS Tree Canopy Cover (ALASKA)
Alaska
| 2017
NLCD 2017 USFS Tree Canopy Cover (PUERTO RICO & U.S. VIRGIN ISLANDS)
Islands & Territories
| 2017
NLCD 2016 USFS Tree Canopy Cover (ALASKA)
Alaska
| 2016
NLCD 2016 USFS Tree Canopy Cover (HAWAII)
Islands & Territories
| 2016
NLCD 2016 USFS Tree Canopy Cover (PUERTO RICO & U.S. VIRGIN ISLANDS)
Islands & Territories
| 2016
NLCD 2016 USFS Tree Canopy Cover (CONUS)
CONUS
| 2016
NLCD 2015 USFS Tree Canopy Cover (CONUS)
CONUS
| 2015
NLCD 2015 USFS Tree Canopy Cover (HAWAII)
Islands & Territories
| 2015
NLCD 2015 USFS Tree Canopy Cover (ALASKA)
Alaska
| 2015
NLCD 2015 USFS Tree Canopy Cover (PUERTO RICO & U.S. VIRGIN ISLANDS)
Islands & Territories
| 2015
NLCD 2014 USFS Tree Canopy Cover (CONUS)
CONUS
| 2014
NLCD 2014 USFS Tree Canopy Cover (HAWAII)
Islands & Territories
| 2014
NLCD 2014 USFS Tree Canopy Cover (ALASKA)
Alaska
| 2014
NLCD 2014 USFS Tree Canopy Cover (PUERTO RICO & U.S. VIRGIN ISLANDS)
Islands & Territories
| 2014
NLCD 2013 USFS Tree Canopy Cover (CONUS)
CONUS
| 2013
NLCD 2013 USFS Tree Canopy Cover (HAWAII)
Islands & Territories
| 2013
NLCD 2013 USFS Tree Canopy Cover (ALASKA)
Alaska
| 2013
NLCD 2013 USFS Tree Canopy Cover (PUERTO RICO & U.S. VIRGIN ISLANDS)
Islands & Territories
| 2013
NLCD 2012 USFS Tree Canopy Cover (CONUS)
CONUS
| 2012
NLCD 2012 USFS Tree Canopy Cover (HAWAII)
Islands & Territories
| 2012
NLCD 2012 USFS Tree Canopy Cover (ALASKA)
Alaska
| 2012
NLCD 2012 USFS Tree Canopy Cover (PUERTO RICO & U.S. VIRGIN ISLANDS)
Islands & Territories
| 2012
NLCD 2011 USFS Tree Canopy Cover (CONUS)
CONUS
| 2011
NLCD 2011 USFS Tree Canopy Cover (HAWAII)
Islands & Territories
| 2011
NLCD 2011 USFS Tree Canopy Cover (ALASKA)
Alaska
| 2011
NLCD 2011 USFS Tree Canopy Cover (PUERTO RICO & U.S. VIRGIN ISLANDS)
Islands & Territories
| 2011
NLCD ALL USFS Tree Canopy Cover (CONUS)
CONUS
| 2011-2021
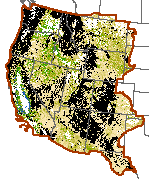
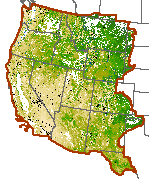
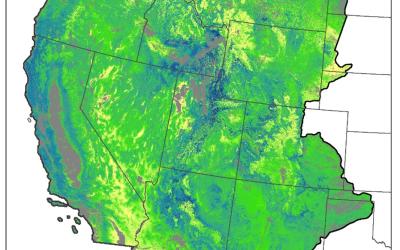
RCMAP - Time-Series - Cover
V5 RCMAP Factsheet.pdf2.14 MB
The RCMAP product suite includes 10 components: annual herbaceous, bare ground, herbaceous, litter, non-sagebrush shrub, perennial herbaceous, sagebrush, shrub, tree, and shrub height. Data characterize the percentage of each 30-meter pixel in the Western United States covered by each component for each year from 1985-2023 - providing change information for 39 years. Because of file size limitations, individual years of component cover data are packaged in three time intervals including 1985-1996, 1997-2008, and 2009-2023. Perennial herb and non-sagebrush shrub are derivatives of herbaceous and annual herbaceous cover, and shrub and sagebrush cover, respectively. (Read More)
RCMAP Annual Herbaceous Cover
Western U.S.
| 2009-2023
RCMAP Shrub Cover
Western U.S.
| 2009-2023
RCMAP Shrub Cover
Western U.S.
| 1997-2008
RCMAP Shrub Cover
Western U.S.
| 1985-1996
RCMAP Sagebrush Cover
Western U.S.
| 2009-2023
RCMAP Sagebrush Cover
Western U.S.
| 1997-2008
RCMAP Sagebrush Cover
Western U.S.
| 1985-1996
RCMAP Litter Cover
Western U.S.
| 2009-2023
RCMAP Litter Cover
Western U.S.
| 1997-2008
RCMAP Litter Cover
Western U.S.
| 1985-1996
RCMAP Herbaceous Cover
Western U.S.
| 2009-2023
RCMAP Herbaceous Cover
Western U.S.
| 1997-2008
RCMAP Herbaceous Cover
Western U.S.
| 1985-1996
RCMAP Bare Ground Cover
Western U.S.
| 2009-2023
RCMAP Bare Ground Cover
Western U.S.
| 1997-2008
RCMAP Bare Ground Cover
Western U.S.
| 1985-1996
RCMAP Non-sagebrush Shrub Cover
Western U.S.
| 2009-2023
RCMAP Perennial Herbaceous Cover
Western U.S.
| 2009-2023
RCMAP Tree Cover
Western U.S.
| 2009-2023
RCMAP Shrub Height
Western U.S.
| 2009-2023
RCMAP Annual Herbaceous Cover
Western U.S.
| 1997-2008
RCMAP Non-sagebrush Shrub Cover
Western U.S.
| 1997-2008
RCMAP Perennial Herbaceous Cover
Western U.S.
| 1997-2008
RCMAP Tree Cover
Western U.S.
| 1997-2008
RCMAP Shrub Height
Western U.S.
| 1997-2008
RCMAP Annual Herbaceous Cover
Western U.S.
| 1985-1996
RCMAP Non-sagebrush Shrub Cover
Western U.S.
| 1985-1996
RCMAP Perennial Herbaceous Cover
Western U.S.
| 1985-1996
RCMAP Tree Cover
Western U.S.
| 1985-1996
RCMAP Shrub Height
Western U.S.
| 1985-1996