Having an accurate picture of an area's landscape and understanding how that landscape is changing is important information for any planning effort. Land cover data can help provide that big-picture view.
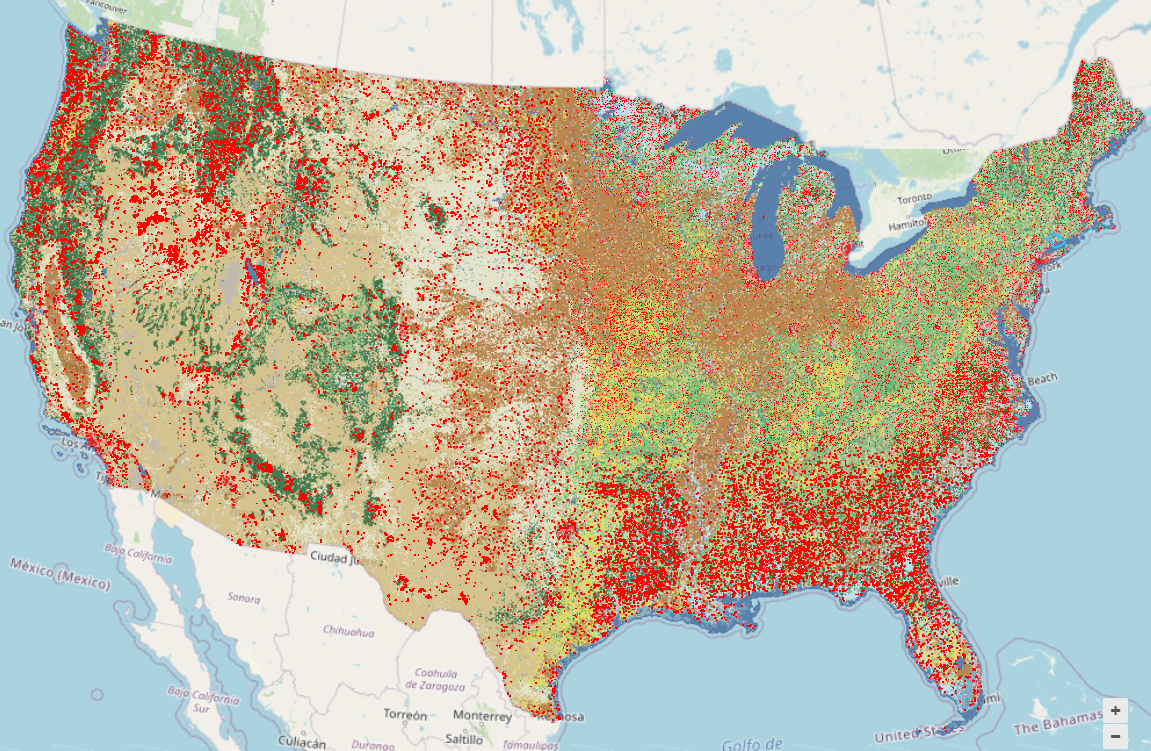
The data seen in the map below was derived through the Multi Resolution Land characteristics Consortium (MRLC). The MRLC produces the National Landcover Database (NLCD), a nationally standardized land cover and land change information product for the United States Multiple dates of satellite imagery are used to document changes in various types of land cover. The land cover for can be seen below.
These summary sheets provide an easy way to understand some of the important information derived from these data for .
Page 1 of 8
Print Date:
Land Cover Data Sheet
www.mrlc.gov/data
Land Cover Overview
Land Cover Basics
percent or square miles of this changed.
Communities comparing data from one year to the next can evaluate how their land use management efforts are working, and can also use information on trends to aid future planning initiatives. In this bar chart, showing each land cover class, the difference between the two bars represents the net difference in the area for that category. This data represents a beginning to end year comparison,and does not quantify cumulative change between years. For instance, an evergreen forest that was harvested after the beginning year and re-grew to Evergreen forest before the end year would not be represented in the statistics. Additional GIS analysis is needed for this type of cumulative change. Other data sources available through the MRLC consortium include developed impervious surface, percent forest canopy cover, and nine discrete rangeland components for the Western United States. All of these additional components provide increased and complementary detail for analysis across the United States.Page 2 of 8
Print Date:
Land Cover Data Sheet
www.mrlc.gov/data
Land Cover Overview
Area Gained - Area Lost = Net change
Net change numbers can be deceiving; forests may be lost on one side of the , while another area may experience an increase. The net change might be minimal, yet the total area of change could be substantial, and the quality of new growth areas may be different than those lost. It is important to look at these offsetting losses and gains, in addition to the overall net difference.
Page 3 of 8
Print Date:
Land Cover Data Sheet
www.mrlc.gov/data
Development
Development and Impervious Surfaces (2006)
% of Noble County is developed and % is impervious.
More development means more impervious surfaces, which translates into a greater risk for increased flooding and decreased water quality. Areas with impervious surface rates approaching or exceeding 12 percent to 15 percent will likely experience negative impacts to water quality. Severe degradation can be expected when rates reach 25 percent. This chart highlights the percentage of the developed in 2006.
Development Change
square miles of development and square miles of impervious surfaces were gained between 1996 and 2006.
Low density and open space development can impact water quality negatively, though usually to a lesser degree than with higher density development. This graph shows how each type of development changed between 1996 and 2006.
What's Being Lost
Unlike natural land cover changes, land lost to development tends to be permanent. This graph shows the types of lands that changed to developed between 1996 and 2006. It does not show any potential losses of previously developed areas, as this is a rare occurrence.
Page 4 of 8
Print Date:
Current State of Forests (2006)
% of Noble County is forest.
Healthy forests are a vital part of a healthy ecosystem, but it is important to understand the types of forest that are present. This chart shows the percentage of the that is forested as well as the percentage in uplands and wetlands.
Forest Change
square miles of the forest was between 1996 and 2006.
Knowing which types of forests are being lost or gained can be as important as knowing about changes in the total forest area. Different forest types can differ in ecosystem value. This graph highlights changes in each forest type over a specific time frame.
What is Changing
A forest can go through a transitional period after a fire, other natural disaster, or logging operation, but typically can be expected to recover. Some losses, such as forests converted to development, tend to be permanent. This graph highlights the transformation of forestlands into different land cover types. It also highlights the origin of any forest gains.
Page 5 of 8
Print Date:
Land Cover Data Sheet
www.mrlc.gov/data
Wetlands
Current State of Wetlands (2006)
% of Noble County is wetland.
Wetlands are among the most productive environments on Earth. Wetlands provide habitat and food, buffer the impacts of storm surge and flooding, and help control erosion. Wetlands also absorb, store, and filter urban and agricultural runoff to maintain water quality. This chart highlights how much of the is covered by wetlands.
Wetland Change
square miles of wetlands were between 1996 and 2006.
When a wetland area or type undergoes change, the benefits of the wetland will change as well. Understanding which type of wetland is changing, and how, can help in determining the eventual impacts of the change. This graph highlights the change or changes in each type of wetland.
What Is Changing
Understanding wetland changes can help communities identify potential management actions to reverse or mitigate the trend. This graph highlights the transformation of lost wetlands into different land cover types. It also highlights the origin of any wetland gains.
Page 6 of 8
Print Date:
Land Cover Data Sheet
www.mrlc.gov/data
Agriculture
Current State of Agriculture (2006)
% of Noble County is agriculture.
NLCD Agriculture classes include land used for production of annual crops as well as areas intensively managed for livestock production. Agricultural areas are managed in in a variety of ways including tillage, fertilization, and other man-made interventions that make the area more productive than it would be naturally.
Agriculture Change
square miles of agriculture were between 1996 and 2006.
Agricultural lands can have a high impact on surrounding areas. This can be for a variety of reasons including runoff, pesticide application, fertilizer application, etc. This can also show conversion of natural areas to more highly managed areas which relate to overall increases for local impacts. This can also include areas of hay pasture, which generally have lower impacts on the landscape, to higher production cultivated crops. Decreasing agricultural land can show habitat restoration, increased urbanization, decreasing water availability, and a host of other factors important for resource managers and local communities.
What Is Changing
As agricultural lands increase or decrease, a variety of impacts can happen. Increasing agricultural lands can sometimes identify increased water usage as well as loss of natural habitat. Decreasing agricultural lands can highlight droughts, long-term water shortages, habitat restoration, etc. etc. Understanding how these changes are occurring and to what extent help to identify usage and potential risks for producers and the community.
Page 7 of 8
Print Date:
Land Cover Data Sheet
www.mrlc.gov/data
Digging Deeper
Understanding how your 's land cover has changed over the years is an excellent way to document trends, understand the effects of past land use decisions, and consider future land use planning needs. This report, which covers 1996 and 2006, provides a solid foundation.
Communities adding additional data and analysis are able to generate findings designed to meet their specific needs. There are additional tools developed by NOAA's Digital Coast. This provides data and information useful for this purpose in coastal areas. Visit the website at coast.noaa.gov/digitalcoast. Some examples are listed below.
Land Cover Resources
Interested in more information related to land cover, or in taking this analysis one step further? Start with the following tools that use land cover to analyze specific issues.- Nonpoint - Source Pollution and Erosion Comparison Tool - Investigates potential water quality impacts from development, and other change. coast.noaa.gov/nspect
- Coastal County Snapshots- Provides local officials with easy-to-understand graphics and analysis that cover a county's demographics, infrastructure, and environment. https://coast.noaa.gov/snapshots
- Sea Level Rise Impacts Viewer- Displays maps of potential impacts of sea level rise along the coast and provides related information and data for community officials. https://coast.noaa.gov/slr
- Coastal Flood Exposure Mapper- Supports communities that are assessing their coastal hazard risks and vulnerabilities. The tool creates a collection of user-defined maps that show the people, places, and natural resources exposed to coastal flooding. https://coast.noaa.gov/floodexposure
About the Source Data
The data seen in the map below was derived through the MRLC(Multi Resolution Land characteristics Consortium). The MRLC produces the National Landcover Database (NLCD), a nationally standardized land cover and land change information product for the United States. Multiple dates of satellite imagery are used to document changes in various types of land cover.
- Notes and Limitations While efforts have been made to ensure that data are accurate and reliable within the limits of current technology, NLCD data sets were made for analysis at a regional and national scale. These data are intended for use in identifying regional landscape patterns and major functional habitats. NLCD is a national and regional data set that should be used only as a screening tool for very local or site-specific management decisions. Small features and changes should be verified with a higher resolution data source. Additional resources on accuracy and methodology can be found on the MRLC publications page Publications | Multi-Resolution Land Characteristics (MRLC) Consortium
Page 8 of 8
Print Date: