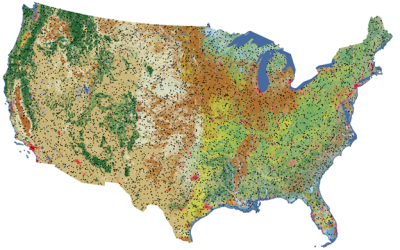
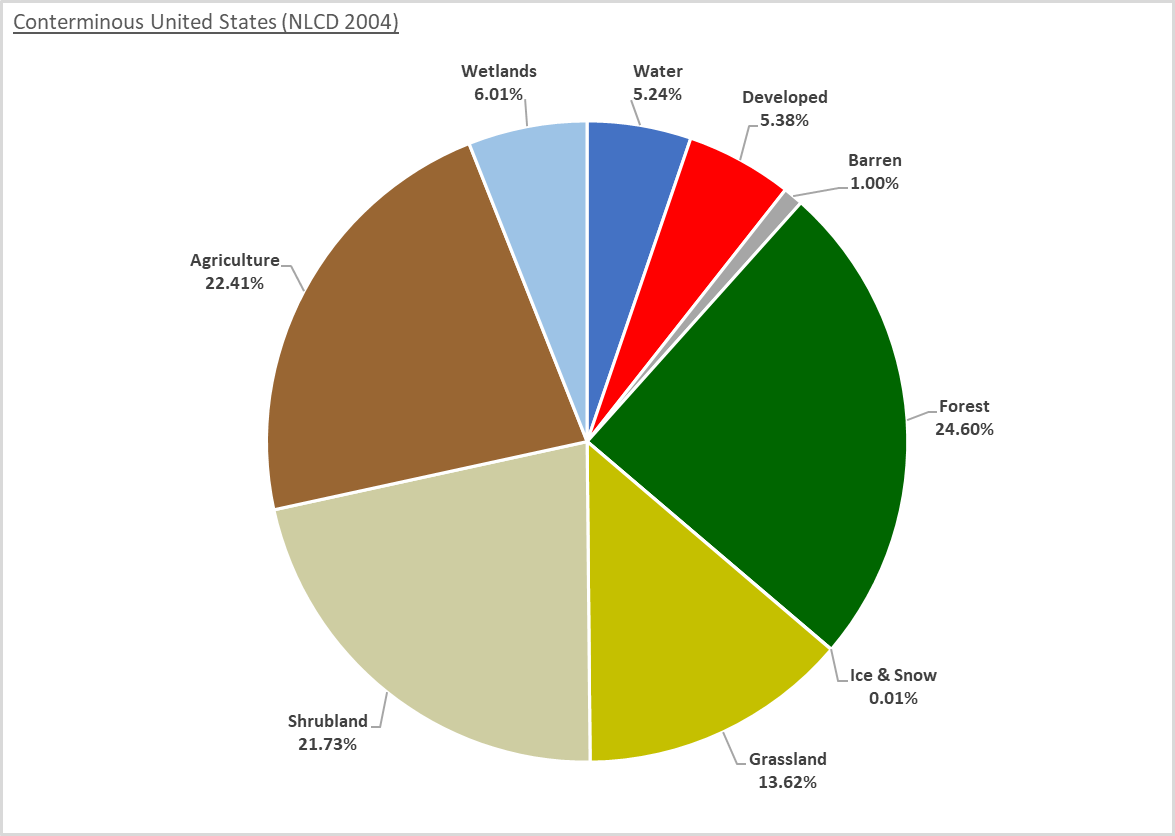
A generalized summary of the main NLCD2019 land cover classes for the conterminous United States (Note: Some NLCD2019 land cover classes have been grouped for display purposes. A detailed conterminous United States class proportions are described in the table below).
| 2004 Land Cover Class for the conterminous United States | Percentage |
| 11. Water | 5.24 |
| 12. Perennial Ice Snow | 0.01 |
| 21. Developed, Open Space | 2.67 |
| 22. Developed, Low Intensity | 1.62 |
| 23. Developed, Medium Intensity | 0.80 |
| 24. Developed High Intensity | 0.29 |
| 31. Bare Rock/Sand/Clay | 1.00 |
| 41. Deciduous Forest | 9.47 |
| 42. Evergreen Forest | 11.72 |
| 43. Mixed Forest | 3.41 |
| 52. Shrub/Scrub | 21.73 |
| 71. Grasslands/Herbaceous | 13.62 |
| 81. Pasture/Hay | 6.68 |
| 82. Cultivated Crops | 15.73 |
| 90. Woody Wetlands | 4.40 |
| 95. Emergent Herbaceous Wetlands | 1.61 |
| Total | 100.00% |
A detailed description of all NLCD2019 land cover class proportions across the conterminous United States. Note: This table is for illustrative purposes only, we encourage you to download the most recent NLCD2019 data file to complete detailed land cover analysis.