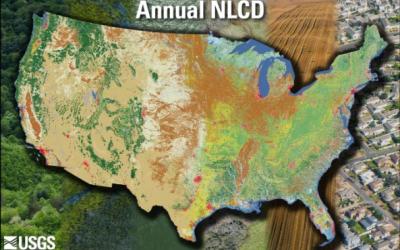
Land Cover
The National Land Cover Database (NLCD) provides nationwide data on land cover and land cover change at a 30m resolution with a 16-class legend based on a modified Anderson Level II classification system. NLCD 2021 represents the latest evolution of NLCD land cover products focused on providing innovative land cover and land cover change data for the Nation. NLCD 2021 offers 9 integrated epochs of land cover for years 2001, 2004, 2006, 2008, 2011, 2013, 2016, 2019, and 2021. chs (2001 – 2021) and are directly comparable across the full time series and suitable for multi-temporal analysis. The NLCD 2021 release is update based, so the Land Cover and Impervious Surface products released in 2019 are unchanged and can be used directly with NLCD 2021. Science products and the change index will need to be reacquired to contain the additional 2021 change. Specific map products include:Developed classes in these years are directly derived from percent developed impervious surface and include a descriptor label that identifies the type of each impervious surface pixel. The NLCD Land Cover change index combines information from all years of land cover change and provides a simple and comprehensive way to visualize change from all 9 dates of land cover in a single layer. The change index was designed to assist NLCD users to understand complex land cover change with a single product. NLCD 2021 does not yet contain updated products for Alaska, Hawaii and Puerto Rico. (Read More)
NLCD Land Cover Change Index (CONUS)
CONUS
| 2021, 2019, 2016, 2013, 2011, 2008, 2006, 2004, 2001
NLCD Land Cover (CONUS) All Years
CONUS
| 2021, 2019, 2016, 2013, 2011, 2008, 2006, 2004, 2001
NLCD 2021 Land Cover (CONUS)
CONUS
| 2021
North American Land Change Monitoring System
North America
| 2020
NLCD 2019 Land Cover (CONUS)
CONUS
| 2019
NLCD 2016 Land Cover (CONUS)
CONUS
| 2016
NLCD 2016 Land Cover (ALASKA)
Alaska
| 2016
NLCD 2013 Land Cover (CONUS)
CONUS
| 2013
NOAA 2011 High Resolution Land Cover (HAWAII)
Islands & Territories
| 2011
NLCD 2011 Land Cover (CONUS)
CONUS
| 2011
NLCD 2011 Land Cover (ALASKA)
Alaska
| 2011
NLCD 2011 to 2016 Land Cover Change (ALASKA)
Alaska
| 2011, 2016
NLCD 2011 from-to 2016 Land Cover Change Pixels (ALASKA)
Alaska
| 2011, 2016
NLCD 2008 Land Cover (CONUS)
CONUS
| 2008
NLCD 2006 Land Cover (CONUS)
CONUS
| 2006
NOAA 2005 to 2011 High Resolution Land Cover Change (HAWAII)
Islands & Territories
| 2005, 2011
NOAA 2005 Land Cover (HAWAII)
Islands & Territories
| 2005
NLCD 2004 Land Cover (CONUS)
CONUS
| 2004
NOAA 2001 to 2005 Land Cover Change (HAWAII)
Islands & Territories
| 2001, 2005
NLCD 2001 Land Cover (CONUS)
CONUS
| 2001
NLCD 2001 to 2011 Land Cover Change (ALASKA)
Alaska
| 2001, 2011
NLCD 2001 from-to 2011 Land Cover Change Pixels (ALASKA)
Alaska
| 2001, 2011
NLCD 2001 Land Cover (ALASKA)
Alaska
| 2001
NLCD 2001 Land Cover (PUERTO RICO)
Islands & Territories
| 2001
NLCD 2001 Land Cover (HAWAII)
Islands & Territories
| 2001
NLCD 2001 to 2016 Land Cover Change (ALASKA)
Alaska
| 2001, 2016
NLCD 2001 from-to 2016 Land Cover Change Pixels (ALASKA)
Alaska
| 2001, 2016
Urban Imperviousness
NLCD imperviousness products represent urban impervious surfaces as a percentage of developed surface over every 30-meter pixel in the United States. The NLCD 2021 release is update based, so the Impervious Surface products released in 2019 are unchanged and can be used directly with NLCD 2021.This update provides integrated analysis throughout all dates and includes a matching impervious surface descriptor layer. This descriptor layer identifies types of roads, wind tower sites, building locations, and energy production sites to allow a deeper analysis of developed features. No new imperviousness products for Alaska, Hawaii and Puerto Rico are available for NLCD 2021. (Read More)
NLCD Imperviousness (CONUS) All Years
CONUS
| 2021, 2019, 2016, 2013, 2011, 2008, 2006, 2004, 2001
NLCD 2021 Developed Imperviousness Descriptor (CONUS)
CONUS
| 2021
NLCD 2021 Percent Developed Imperviousness (CONUS)
CONUS
| 2021
NLCD 2019 Percent Developed Imperviousness (CONUS)
CONUS
| 2019
NLCD 2019 Developed Imperviousness Descriptor (CONUS)
CONUS
| 2019
NLCD 2016 Percent Developed Imperviousness (CONUS)
CONUS
| 2016
NLCD 2016 Developed Imperviousness Descriptor (CONUS)
CONUS
| 2016
NLCD 2016 Percent Developed Imperviousness Zone 8 (ALASKA)
Alaska
| 2016
NLCD 2016 Developed Impervious Descriptor Zone 8 (ALASKA)
Alaska
| 2016
NLCD 2016 Developed Urban Descriptor (ALASKA)
Alaska
| 2016
NLCD 2013 Developed Imperviousness (CONUS)
CONUS
| 2013
NLCD 2013 Developed Imperviousness Descriptor (CONUS)
CONUS
| 2013
NLCD 2011 Percent Developed Imperviousness (CONUS)
CONUS
| 2011
NLCD 2011 Percent Developed Imperviousness Zone 8 (ALASKA)
Alaska
| 2011
NLCD 2011 Developed Imperviousness Descriptor (CONUS)
CONUS
| 2011
NLCD 2011 to 2016 Developed Imperviousness Zone 8 Change (ALASKA)
Alaska
| 2011, 2016
NLCD 2011 Developed Impervious Descriptor Zone 8 (ALASKA)
Alaska
| 2011
NLCD 2011 Developed Urban Descriptor (ALASKA)
Alaska
| 2011
NLCD 2008 Percent Developed Imperviousness (CONUS)
CONUS
| 2008
NLCD 2008 Developed Imperviousness Descriptor (CONUS)
CONUS
| 2008
NLCD 2006 Percent Developed Imperviousness (CONUS)
CONUS
| 2006
NLCD 2006 Developed Imperviousness Descriptor (CONUS)
CONUS
| 2006
NLCD 2004 Percent Developed Imperviousness (CONUS)
CONUS
| 2004
NLCD 2004 Developed Imperviousness Descriptor (CONUS)
CONUS
| 2004
NLCD 2001 Percent Developed Imperviousness (CONUS)
CONUS
| 2001
NLCD 2001 Developed Imperviousness Descriptor (CONUS)
CONUS
| 2001
NLCD 2001 to 2011 Developed Imperviousness Zone 8 Change (ALASKA)
Alaska
| 2001, 2011
NLCD 2001 Percent Developed Imperviousness Zone 8 (ALASKA)
Alaska
| 2001
NLCD 2001 Percent Developed Impervious (HAWAII)
Islands & Territories
| 2001
NLCD 2001 Percent Developed Imperviousness (PUERTO RICO)
Islands & Territories
| 2001
NLCD 2001 to 2016 Developed Imperviousness Zone 8 Change (ALASKA)
Alaska
| 2001, 2016
NLCD 2001 Developed Impervious Descriptor Zone 8 (ALASKA)
Alaska
| 2001
NLCD 2001 Developed Urban Descriptor (ALASKA)
Alaska
| 2001
Exotic Annual Grass
The Exotic Annual Grass (EAG) abundance dataset provides early season percent cover estimate of the exotic grass species in 30m spatial resolution for a mapped year in rangeland ecosystems of western United States. We plan to release these EAG estimates multiple times each year in early growing season. EAG is a continuous field consisting of abundance of non-native grass species whose life history is complete in one growing season. Cheatgrass (Bromus tectorum) is a dominant species, but this dataset also includes Bromus arvensis L., Bromus briziformis Fisch. & C.A. Mey. Bromus catharticus Vahl, Bromus commutatus Schrad, Bromus diandrus Roth, Bromus hordeaceus L., Bromus hordeaceus spp. Hordeaceus, Bromus japonicus Thunb, Bromus madritensis L., Bromus madritensis L. ssp. rubens (L.) Duvin, Bromus racemosus L., Bromus rubens L., Bromus secalinus L., Bromus texensis (Shear) Hitchc, and medusahead (Taeniatherum caput-medusae (L.) Nevski). A main objective of releasing these maps is to provide a tool for better monitoring EAG dynamics and informing conservation and management efforts at local to regional scales. (Read More)
Exotic Annual Grass Confidence Level June 19th, 2023
Western U.S.
| 2023
Exotic Annual Grass Percent Cover June 19th, 2023
Western U.S.
| 2023
Exotic Annual Grass Confidence Level June 12th, 2023
Western U.S.
| 2023
Exotic Annual Grass Percent Cover June 12th, 2023
Western U.S.
| 2023
Exotic Annual Grass Confidence Level June 5th, 2023
Western U.S.
| 2023
Exotic Annual Grass Percent Cover June 5th, 2023
Western U.S.
| 2023
Exotic Annual Grass Confidence Level May 29th, 2023
Western U.S.
| 2023
Exotic Annual Grass Percent Cover May 29th, 2023
Western U.S.
| 2023
Exotic Annual Grass Confidence Level May 22nd, 2023
Western U.S.
| 2023
Exotic Annual Grass Percent Cover May 22nd, 2023
Western U.S.
| 2023
Exotic Annual Grass Confidence Level May 15th, 2023
Western U.S.
| 2023
Exotic Annual Grass Percent Cover May 15th, 2023
Western U.S.
| 2023
Exotic Annual Grass Confidence Level May 8th, 2023
Western U.S.
| 2023
Exotic Annual Grass Percent Cover May 8th, 2023
Western U.S.
| 2023
Exotic Annual Grass Confidence Level May 1st, 2023
Western U.S.
| 2023
Exotic Annual Grass Percent Cover May 1st, 2023
Western U.S.
| 2023
Exotic Annual Grass Percent Cover - July 01, 2022
Western U.S.
| 2022
Exotic Annual Grass Confidence Level - July 01, 2022
Western U.S.
| 2022
Exotic Annual Grass Percent Cover - June 15, 2022
Western U.S.
| 2022
Exotic Annual Grass Confidence Level - June 15, 2022
Western U.S.
| 2022
Exotic Annual Grass Percent Cover - June 03, 2022
Western U.S.
| 2022
Exotic Annual Grass Confidence Level - June 03, 2022
Western U.S.
| 2022
Exotic Annual Grass Percent Cover - May 18, 2022
Western U.S.
| 2022
Exotic Annual Grass Confidence Level - May 18, 2022
Western U.S.
| 2022
Exotic Annual Grass Percent Cover - May 06, 2022
Western U.S.
| 2022
Exotic Annual Grass Confidence Level - May 06, 2022
Western U.S.
| 2022
Exotic Annual Grass Percent Cover - July 2021
Western U.S.
| 2021
Exotic Annual Grass Confidence Level - July 2021
Western U.S.
| 2021
Exotic Annual Grass Percent Cover - May 2021
Western U.S.
| 2021
Exotic Annual Grass Confidence Level - May 2021
Western U.S.
| 2021
Tree Canopy
NLCD tree canopy cover is a 30 m raster geospatial dataset that is available for the conterminous United States. They are generated by the USDA Forest Service. These data contain percent tree canopy estimates, as a continuous variable, for each pixel across all land covers and types. Tree canopy cover is derived from multi-spectral satellite imagery and other available ground and ancillary information. 2011 through 2021 Forest canopy products are available for the conterminous United States, and will be available for coastal Alaska, Hawaii, Puerto Rico, and American Virgin Islands in the summer of 2023. (Read More)
NLCD 2021 Tree Canopy Cover (CONUS)
CONUS
| 2021
NLCD 2020 Tree Canopy Cover (CONUS)
CONUS
| 2020
NLCD 2019 Tree Canopy Cover (CONUS)
CONUS
| 2019
NLCD 2018 Tree Canopy Cover (CONUS)
CONUS
| 2018
NLCD 2017 Tree Canopy Cover (CONUS)
CONUS
| 2017
NLCD 2016 USFS Tree Canopy Cover (ALASKA)
Alaska
| 2016
NLCD 2016 USFS Tree Canopy Cover (HAWAII)
Islands & Territories
| 2016
NLCD 2016 USFS Tree Canopy Cover (PUERTO RICO)
Islands & Territories
| 2016
NLCD 2016 Tree Canopy Cover (CONUS)
CONUS
| 2016
NLCD 2015 Tree Canopy Cover (CONUS)
CONUS
| 2015
NLCD 2014 Tree Canopy Cover (CONUS)
CONUS
| 2014
NLCD 2013 Tree Canopy Cover (CONUS)
CONUS
| 2013
NLCD 2012 Tree Canopy Cover (CONUS)
CONUS
| 2012
NLCD ALL Tree Canopy Cover (CONUS)
CONUS
| 2011-2021
NLCD 2011 USFS Tree Canopy Cover (ALASKA)
Alaska
| 2011
NLCD 2011 USFS Tree Canopy Cover (HAWAII)
Islands & Territories
| 2011
NLCD 2011 USFS Tree Canopy Cover (PUERTO RICO)
Islands & Territories
| 2011
NLCD USFS Tree Canopy Change (ALASKA)
Alaska
| 2011, 2016
NLCD USFS Tree Canopy Change (HAWAII)
Islands & Territories
| 2011, 2016
NLCD USFS Tree Canopy Change (PUERTO RICO)
Islands & Territories
| 2011, 2016
NLCD 2011 Tree Canopy Cover (CONUS)
CONUS
| 2011
RCMAP – Basemap (2016)
RCMAP base component products characterize the percentage of each 30-meter pixel in the Western United States covered by shrub, herbaceous, bare ground, litter, sagebrush, big sagebrush and annual herbaceous, along with estimating shrub height and sagebrush height. These products have been produced by USGS in collaboration with the Bureau of Land Management. Component products are designed to be used individually or combined to support a broad variety of applications.
Please note these new Revised (071520) rangeland products will differ from the first generation of circa 2016 fractional cover maps, a more aggressive masking of tree canopy cover was applied to each rangeland component. Specifically, we have lowered the tree canopy cover threshold for exclusion from 40 to 25%. For pixels with 1-25% tree canopy cover we ensured that our primary components (shrub, herbaceous, litter, and bare ground) cover summed to 100% when added with the tree canopy. And, for the secondary components (sagebrush, big sagebrush, sagebrush height and shrub height) we reconciled to the primary component (shrub), excluding any pinyon-juniper woodlands. (Read More)
NLCD 2016 All Rangeland Cover
Western U.S.
| 2016
NLCD 2016 Bare Ground Rangeland Cover
Western U.S.
| 2016
NLCD 2016 Big Sagebrush Rangeland Cover
Western U.S.
| 2016
NLCD 2016 Annual Herbaceous Rangeland Cover
Western U.S.
| 2016
NLCD 2016 Herbaceous Rangeland Cover
Western U.S.
| 2016
NLCD 2016 Litter Rangeland Cover
Western U.S.
| 2016
NLCD 2016 Sagebrush Rangeland Cover
Western U.S.
| 2016
NLCD 2016 Sagebrush Height Rangeland Cover
Western U.S.
| 2016
NLCD 2016 Shrub Rangeland Cover
Western U.S.
| 2016
NLCD 2016 Shrub Height Rangeland Cover
Western U.S.
| 2016
RCMAP - Time-Series - Trends
Currently available trends statistics are for the 1985-2021 time-series.
The RCMAP product suite consists of nine fractional components: annual herbaceous, bare ground, herbaceous, litter, non-sagebrush shrub, perennial herbaceous, tree, sagebrush and shrub, rule-based error maps, and the temporal trends of each. Data characterize the percentage of each 30-meter pixel in the Western United States covered by each component for each year from 1985-2021 - providing change information for 35 years (imagery for 2012 was unavailable). Because of file size limitations, individual component products are packaged in three historic intervals including 1985-1995, 1996-2006, and 2007-2021. Trend analysis for each component is also available as a zip file for the full 1985-2021 period to help users understand the magnitude of change. (Read More)
Break Point Presence/Absence in Each Year Annual Herbaceous
Western U.S.
| Time Series Trends
Break Point Presence/Absence in Each Year Bare Ground
Western U.S.
| Time Series Trends
Break Point Presence/Absence in Each Year Herbaceous
Western U.S.
| Time Series Trends
Break Point Presence/Absence in Each Year Litter
Western U.S.
| Time Series Trends
Break Point Presence/Absence in Each Year Non Sagebrush Shrub
Western U.S.
| Time Series Trends
Break Point Presence/Absence in Each Year Perennial Herbaceous
Western U.S.
| Time Series Trends
Slope of Segment in Each Year Shrub
Western U.S.
| Time Series Trends
Break Point Presence/Absence in Each Year Sagebrush
Western U.S.
| Time Series Trends
Break Point Presence/Absence in Each Year Shrub
Western U.S.
| Time Series Trends
Break Point Presence/Absence in Each Year Tree
Western U.S.
| Time Series Trends
Break Point Count
Western U.S.
| Time Series Trends
P-Value of Segment in Each Year Annual Herbaceous
Western U.S.
| Time Series Trends
P-Value of Segment in Each Year Bare Ground
Western U.S.
| Time Series Trends
P-Value of Segment in Each Year Herbaceous
Western U.S.
| Time Series Trends
P-Value of Segment in Each Year Litter
Western U.S.
| Time Series Trends
P-Value of Segment in Each Year Non Sagebrush Shrub
Western U.S.
| Time Series Trends
P-Value of Segment in Each Year Perennial Herbaceous
Western U.S.
| Time Series Trends
P-Value of Segment in Each Year Sagebrush
Western U.S.
| Time Series Trends
P-Value of Segment in Each Year Shrub
Western U.S.
| Time Series Trends
P-Value of Segment in Each Year Tree
Western U.S.
| Time Series Trends
P-Value of Linear Model
Western U.S.
| Time Series Trends
Slope of Linear Model
Western U.S.
| Time Series Trends
Slope of Segment in Each Year Annual Herbaceous
Western U.S.
| Time Series Trends
Slope of Segment in Each Year Bare Ground
Western U.S.
| Time Series Trends
Slope of Segment in Each Year Herbaceous
Western U.S.
| Time Series Trends
Slope of Segment in Each Year Litter
Western U.S.
| Time Series Trends
Slope of Segment in Each Year Non Sagebrush Shrub
Western U.S.
| Time Series Trends
Slope of Segment in Each Year Perennial Herbaceous
Western U.S.
| Time Series Trends
Slope of Segment in Each Year Sagebrush
Western U.S.
| Time Series Trends
Slope of Segment in Each Year Tree
Western U.S.
| Time Series Trends
Total Change Intensity Index
Western U.S.
| Time Series Trends
Year of Most Recent Break
Western U.S.
| Time Series Trends
RCMAP - Future Projections - 2020s, 2050s, and 2080s
RCMAP projected cover products characterize the fractional (i.e. percentage) cover of shrub, herbaceous, bare ground, litter, sagebrush, and annual herbaceous in each 30-meter pixel in the Western United States. Projected data include three time periods (2020s, 2050s, and 2080s) and two climate scenarios (Representative Concentration Pathways [RCP] 4.5 and 8.5). Component cover were harmonized so that the sum of bare ground, shrub, herbaceous, and litter cover adds to ~100% and secondary components sagebrush and annual herbaceous cover were harmonized to their respective primary components of shrub and herbaceous cover, (so their cover could not be greater than their primary component). These products have been produced by USGS in collaboration with the Bureau of Land Management. Component products are designed to be used individually or combined to support a broad variety of applications. Data are packaged by time-period and climate scenarios (six). Please note that some suspect increases in sagebrush cover are projected in the Southern Great Basin and Southern Colorado Plateau, which we interpret as model error. We have developed a mask (see below) to apply to the future sagebrush cover layers. Masked areas meet three criteria: 1) they are within the sagebrush biome (Jeffries and Finn 2019), 2) within the following EPA level 3 ecoregions: Arizona/New Mexico Mountains, Arizona/New Mexico Plateau (excluding the San Luis Valley from the mask), Colorado Plateaus (excluding the Uinta Basin from the mask), Mojave Basin and Range, and Sonoran Basin and Range, and 3) have a maximum of 0% sagebrush cover observed over the 1985-2020 RCMAP time-series. (Read More)
Rangeland – Future Projections 2080s – rcp 4.5
Western U.S.
| 2080s
Rangeland – Future Projections 2080s – rcp 8.5
Western U.S.
| 2080s
Rangeland – Future Projections 2050s – rcp 4.5
Western U.S.
| 2050s
Rangeland – Future Projections 2050s – rcp 8.5
Western U.S.
| 2050s
Rangeland – Future Projections 2020s – rcp 4.5
Western U.S.
| 2020s
Rangeland – Future Projections 2020s – rcp 8.5
Western U.S.
| 2020s
Sagebrush Mask for Future Projections
Western U.S.
| 2020s, 2050s, 2080s
RCMAP - Time-Series - Cover
V5 RCMAP Factsheet.pdf2.14 MB
The RCMAP product suite includes nine fractional components: annual herbaceous, bare ground, herbaceous, litter, non-sagebrush shrub, perennial herbaceous, sagebrush, shrub, and tree and the temporal trends of each component. Data characterize the percentage of each 30-meter pixel in the Western United States covered by each component for each year from 1985-2021 - providing change information for 37 years. Because of file size limitations, individual years of component cover data are packaged in three time intervals including 1985-1995, 1996-2006, and 2007-2021. (Read More)
RCMAP Annual Herbaceous Cover
Western U.S.
| 2009-2021
RCMAP Shrub Cover
Western U.S.
| 2009-2021
RCMAP Sagebrush Cover
Western U.S.
| 2009-2021
RCMAP Litter Cover
Western U.S.
| 2009-2021
RCMAP Herbaceous Cover
Western U.S.
| 2009-2021
RCMAP Bare Ground Cover
Western U.S.
| 2009-2021
RCMAP Non-sagebrush Shrub Cover
Western U.S.
| 2009-2021
RCMAP Perennial Herbaceous Cover
Western U.S.
| 2009-2021
RCMAP Tree Cover
Western U.S.
| 2009-2021
RCMAP Shrub Cover
Western U.S.
| 1997-2008
RCMAP Sagebrush Cover
Western U.S.
| 1997-2008
RCMAP Litter Cover
Western U.S.
| 1997-2008
RCMAP Herbaceous Cover
Western U.S.
| 1997-2008
RCMAP Bare Ground Cover
Western U.S.
| 1997-2008
RCMAP Annual Herbaceous Cover
Western U.S.
| 1997-2008
RCMAP Non-sagebrush Shrub Cover
Western U.S.
| 1997-2008
RCMAP Perennial Herbaceous Cover
Western U.S.
| 1997-2008
RCMAP Tree Cover
Western U.S.
| 1997-2008
RCMAP Shrub Cover
Western U.S.
| 1985-1996
RCMAP Sagebrush Cover
Western U.S.
| 1985-1996
RCMAP Litter Cover
Western U.S.
| 1985-1996
RCMAP Herbaceous Cover
Western U.S.
| 1985-1996
RCMAP Bare Ground Cover
Western U.S.
| 1985-1996
RCMAP Annual Herbaceous Cover
Western U.S.
| 1985-1996
RCMAP Non-sagebrush Shrub Cover
Western U.S.
| 1985-1996
RCMAP Perennial Herbaceous Cover
Western U.S.
| 1985-1996
RCMAP Tree Cover
Western U.S.
| 1985-1996
Ecological Potential
Rangeland Ecological Potential - Component Cover, Cover Departure, and Vegetation States.
Ecological Potential rangeland fractional cover data products represent the potential cover given the most productive, least disturbed, portion of the 1985-2020 Landsat archive. Models used to predict Ecological Potential cover were trained on ecologically intact sites where annual herbaceous cover is low, no known disturbance or land treatment has occurred over the study period, and bare ground cover is relatively lower than expectations (Read More)
Ecological Potential Bare Ground Cover
Western U.S.
Ecological Potential Sagebrush Cover
Western U.S.
Ecological Potential Perennial Herbaceous Cover
Western U.S.
Ecological Potential Litter Cover
Western U.S.
Ecological Potential Shrub Cover
Western U.S.
Percent Error for Ecological Potential Bare Ground
Western U.S.
Percent Error for Ecological Potential Sagebrush
Western U.S.
Percent Error for Ecological Potential Perennial Herbaceous
Western U.S.
Percent Error for Ecological Potential Litter
Western U.S.
Percent Error for Ecological Potential Shrub
Western U.S.
Departure of Bare Ground Cover
Western U.S.
Departure of Sagebrush Cover
Western U.S.
Departure of Perennial Herbaceous Cover
Western U.S.
Departure of Litter Cover
Western U.S.
Departure of Shrub Cover
Western U.S.
Ecological Potential Vegetation State
Western U.S.
2018 Vegetation State
Western U.S.