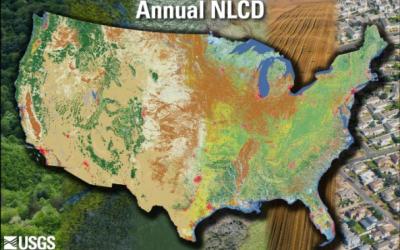
The Annual NLCD Reference & Validation (R&V) is designed to support the development of consistent land cover and land cover change products and data. The R&V process involves collecting reference data to validate Anderson Level II land cover classes and change products across the United States. The R&V team gathers, organizes, and refines an independent reference datasets to generate validation reports for the annual NLCD land cover and land cover change products at the Anderson Level II ontology/taxonomy level.
Producing an independent reference dataset to evaluate the performance and accuracy of the NLCD land cover and change product range is a critical component of the NLCD and R&V program. This independent reference dataset can be utilized to evaluate and validate the Annual NLCD land cover and change products (1).
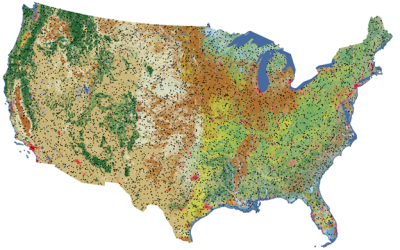
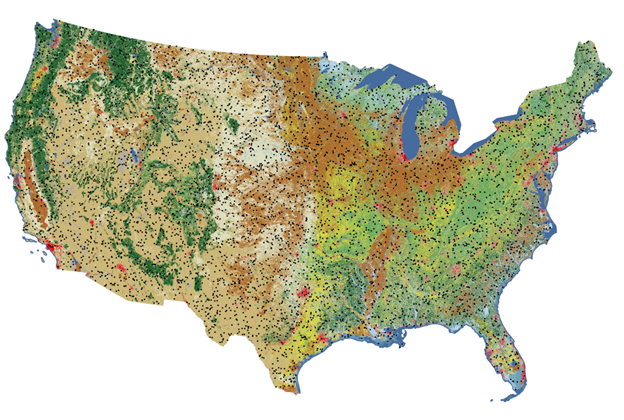
The NLCD reference data products produced by the R&V program is based on 30-meter by 30-meter plots within the conterminous United States. The Annual NLCD reference data sample design was developed as a two-phase collection: an initial base sample containing 5,000 plots chosen via simple random selection, followed by another 3,360 plots (some of which were selected via simple random, while others were targeted at particular map-defined strata). This approach results in a final stratified reference sample of 8,360 plots.
Sources/Usage: Public Domain. View Media Details
Locations of the 8,360 plots included in the reference dataset that were used in the accuracy assessment of Annual NLCD CU 1.0 (1985 – 2023). Each plot includes primary (most likely) and alternate (but could be) land cover type calls for 1984 – 2023.
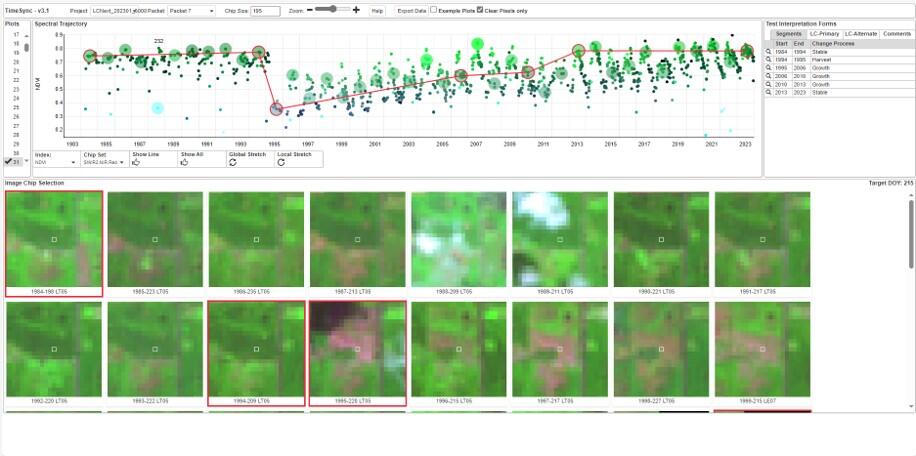
Land use, land cover, and change information for each reference plot is collected annually for the years 1984-2023 using the TimeSync tool, a web-based interface for manually interpreting and recording information from the Landsat dataset. Manual interpretation of Landsat data is further supplemented with fine resolution imagery and other ancillary data. Various quality assurance and quality control (QA/QC) processes are implemented to ensure that the annual NLCD Reference Data Products maintain consistent quality (2).
Sources/Usage: Public Domain. View Media Details
The TimeSync tool is used to record attribute information for each plot. On the interface, the drop in NDVI values is noticeable. When you look at the Landsat images 1994 and 1995, there is a clear difference between the two images. The Landsat image in 1995 shows a harvest with the subsequent years NDVI values showing growth before becoming stable in 2013.
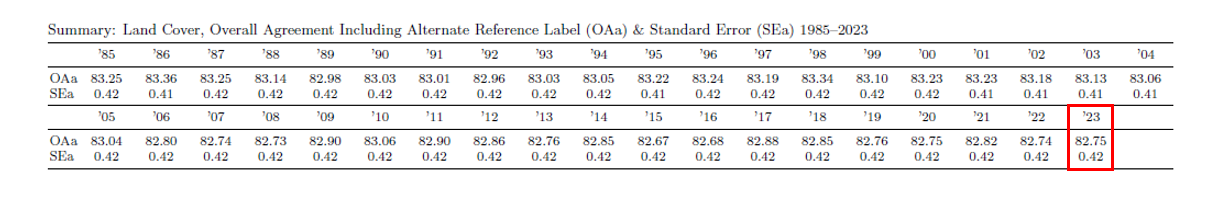
On average, the Annual NLCD land cover matched the expert-reviewed reference data 83% of the time when grouped into broad Anderson Level 1 land cover classes such as forest, shrubland, or developed land. Yearly results are provided in the table below.
Sources/Usage: Public Domain. View Media Details
Table 1. Overall agreement (OAa) and standard error (SEa) (%) between Annual NLCD CU 1.0 at Anderson Level 1 land cover classes and primary (most likely) or alternate (but could be) land cover labels for CONUS, 1985-2023. For example, the 2023 land cover product was found to have an accuracy of 82.75% at Anderson Level 1 classes with a low standard error of 0.42, indicating that the accuracy measurement is reliable.
Product Contents
The annual NLCD Reference Data Product is packaged in a zipped file containing reference data for the initial 8,360 plots in three formats:
- Tabular (.csv) collection of the annual NLCD reference dataset annual attributes (1984 –2023) for each of the 8,360 plots.
- Vector-format shapefile (.shp) for the annual NLCD reference dataset showing individual plot (polygon) location outlines for each of the 8,360 plots.
- Tagged image format (.tif) map of stratum class (determined by land cover change type of the pixel).
Data Access
- MRLC - NLCD Reference & Validation | Multi-Resolution Land Characteristics (MRLC) Consortium
- Reference Data - Annual National Land Cover Database (NLCD) Collection 1.0 Reference Data Product - ScienceBase-Catalog
- Validation Data - Annual National Land Cover Database (NLCD) Collection 1.0 Validation Tables - ScienceBase-Catalog
Citation Information
There are no restrictions on the use of the annual NLCD Reference Data Products. It is not a requirement of data use, but the following citation may be used in publication or presentation materials to acknowledge the USGS as a data source and to credit the original research.
U.S. Geological Survey, 2005, Annual National Land Cover Database (NLCD) Collection 1.0 Reference Data Product: U.S. Geological Survey data release, https://doi.org/10.5066/P13EDMAF.
Reference
1. J. Wickham, S. V. Stehman, D. G. Sorenson, L. Gass, J. A. Dewitz, Thematic accuracy assessment of the NLCD 2019 land cover for the conterminous United States. GIScience & Remote Sensing 60, (2023).
2. S. V. Stehman, B. W. Pengra, J. A. Horton, D. F. Wellington, Validation of the U.S. Geological Survey's Land Change Monitoring, Assessment and Projection (LCMAP) Collection 1.0 annual land cover products 1985–2017. Remote Sensing of Environment 265, (2021).