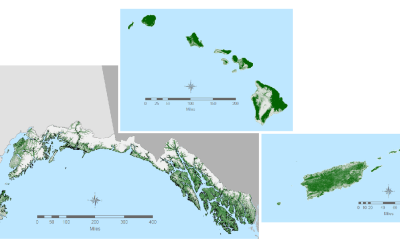
The RCMAP product suite includes 10 components: annual herbaceous, bare ground, herbaceous, litter, non-sagebrush shrub, perennial herbaceous, sagebrush, shrub, and tree and shrub height. Data characterize the percentage of each 30-meter pixel in the Western United States covered by each component for each year from 1985-2025 - providing change information for 41 years. Because of file size limitations, individual years of component cover data are packaged in four time intervals including 1985-1994, 1995-2004, and 2005-2014, and 2015-2025. Perennial herbaceous and non-sagebrush shrub are derivatives of herbaceous and annual herbaceous cover, and shrub and sagebrush cover, respectively.
Several enhancements were made to the RCMAP process relative to prior generations. 1) The training database was expanded by incorporating new observations from the BLM Analysis Inventory and Monitoring dataset, Global Biodiversity Information Facility observations of sagebrush and various invasive grass species, data from central Idaho (Sorrentino et al. In Prep), Uncrewed Aerial Vehicle (UAV) data for Western South Dakota (Johnston et al. 2025), and additional Landsat scale observations collected by RCMAP. 2) 10 new high-resolution training sites were added in the Great Plains. 3) Enhanced noise filtering post-processing using the Savitsky-Golay filter, and 4) integration of Exotic Annual Grass products into the RCMAP hierarchy.
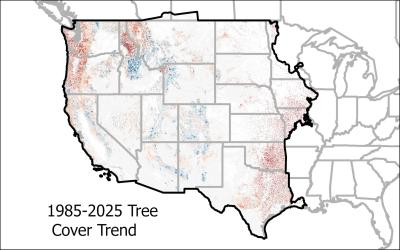
We assess the temporal patterns in each RCMAP component with two approaches, 1) linear trends and 2) a breaks and stable states method with a temporal moving window based on structural change at the pixel level, for information, see RCMAP - Time Series - Trends | Multi-Resolution Land Characteristics (MRLC) Consortium. Linear trend products include slope and p-value calculated from least squares linear regression. The slope represents the average percent cover change per year over the times-series and the p-value reflects the confidence of change in each pixel, see Shi et al. 2022 for more detail. The structural change method partitions the time-series into segments of similar slope values, with statistically significant break-points indicating perturbations to the prior trajectory. The break point trends analysis suite relies on structural break methods, resulting in the identification of the number and timing of breaks in the time-series, and the significance of each segment. We produce the following statistics: 1) for each component, each year, the presence/absence of breaks, 2) the slope, p-value, and standard error of the segment occurring in each year, 3) the overall model R2 (quality of model fit to the temporal profile), and 4) an index, Total Change Intensity. This index reflects the total amount of change occurring across components in that pixel.
Component Definitions
Annual Herbaceous Cover
Annual Herbaceous includes grasses and forbs whose life history is complete in one growing season. This component is primarily dominated by annual invasive species including cheatgrass (Bromus tectorum), medusahead (Taeniatherum caput-medusae), red brome (Bromus rebens), or annual mustards such as tumble mustard (Sisymbrium altissimum) and tansy mustard (Descurainia pinnata). But may contain substantial native annual herbaceous vegetation at higher elevations and in California. This component is nested within Herbaceous as a secondary component.
Herbaceous Cover
Herbaceous consist of grasses, forbs and cacti which were photosynthetically active at any point in the year of mapping.
Perennial Herbaceous Cover
Perennial Herbaceous consist of grasses, forbs and cacti which were photosynthetically active at any point in the year of mapping and whose lifecycle includes more than one growing season (includes biennials).
Litter Cover
Litter consists of dead standing woody vegetation and standing dead grass and forb material that was not actively photosynthesizing at any point in year of mapping. Additionally, Litter includes detached plant organic matter and biological soil crusts.
Bare Ground Cover
Bare Ground consists of exposed soil, sand, and rocks.
Sagebrush Cover
Sagebrush includes almost all species of sagebrush (Artemisia spp.) including big sagebrush (A. tridentata spp.), low sagebrush (A. arbuscula), black sagebrush (A. nova), three-tip sagebrush (A. triparta), sand sagebrush (A. filifolia), silver sagebrush (A. cana). This component is nested within Shrub as a secondary component. Excludes the low stature prairie sage (A. frigida) and white sagebrush (A. ludoviciana).
Non-Sagebrush Shrub Cover
Non-sagebrush Shrub encompasses all shrub species not of the sagebrush (Artemisia spp.) genus. Shrubs, in general, are discriminated by the presence of woody stems and < 6-m in height.
Shrub Cover
Includes all shrub species discriminated by the presence of woody stems and < 6-m in height.
Tree Cover
Tree cover includes vegetation with persistent woody stems > 6m in height. Mature stands of pinyon (Pinus spp.) and juniper (Juniperus spp.) are included regardless of height.
Shrub Height
The average height of all Shrub in centimeters. This component only occurs where the Shrub cover component is greater than 0% Height is given for the portion of pixel with shrubs present. For example, in a pixel where shrub cover is 10% and the average height of those shrubs is 100cm, height will be given as 100cm, not 100cm/10% cover as 10cm.
For more information, see this Video describing the basics on RCMAP data and data access and Video on Visualizing Rangeland Change with RCMAP Data
RCMAP data are also available on ArcGIS Online and Google Earth Engine Awesome Community Catalog.
Preferred Citation:
Rigge, M., Bunde, B., and Postma, K., 2026, Rangeland Condition Monitoring Assessment and Projection (RCMAP) Fractional Component Time-Series Across Western North America from 1985-2025: U.S. Geological Survey data release, https://doi.org/10.5066/P138CYEL.
Related Citations:
Rigge, M., Case, M.F., Shaff, S.E., Ellsworth, L., Bunde, B. and Postma, K., 2025. Correspondence Between Satellite-Derived and Long-Term Field Observations of Vegetation Cover at Great Basin Experimental Treatments. Rangeland Ecology & Management, 103, pp.341-355.
Rigge, M., Bunde, B., McCord, S.E., Harrison, G., Assal, T.J. and Smith, J.L., 2025. Spatial Scale Dependence of Error in Fractional Component Cover Maps. Rangeland Ecology & Management, 99, pp.77-87.
Rigge, M.B., Bunde, B., Postma, K., Oliver, S., and Mueller, C., 2024, Application of normalized radar backscatter and hyperspectral data to augment rangeland vegetation fractional classification: Remote Sensing, v. 16, no. 13, article 2315, at https://doi.org/10.3390/rs16132315.
Shi, H., Rigge, M., Postma, K., and Bunde, B. 2022. Trends analysis of rangeland condition monitoring assessment and projection (RCMAP) fractional component time series (1985-2020). GIScience & Remote Sensing. 59: 1243-1265.
Rigge, M.B., Homer, C.G., Cleeves, L., Meyer, D.K., Bunde, B., Shi, H., Xian, G., Schell, S., and Bobo, M., 2020, Quantifying western U.S. rangelands as fractional components with multi-resolution remote sensing and in situ data: Remote Sensing, v. 12, no. 3, article 412, at https://doi.org/10.3390/rs12030412.
Shi, H., Homer, C.G., Rigge, M.B., Postma, K., and Xian, G., 2020, Analyzing vegetation change in a sagebrush ecosystem using long‐term field observations and Landsat imagery in Wyoming: Ecosphere, v. 11, no. 12, article e03311, at https://doi.org/10.1002/ecs2.3311.
Rigge, M., H. Shi, C. Homer, P. Danielson, and B. Granneman. 2019. Long-term trajectories of fractional component change in the Northern Great Basin, USA. Ecosphere: e02762.
For more information on the RCMAP project see: https://www.usgs.gov/centers/eros/science/rangeland-condition-monitoring-assessment-and-projection-rcmap
For additional information on RCMAP product accuracy variation by ecoregion, cover value, and spatial scale, see here