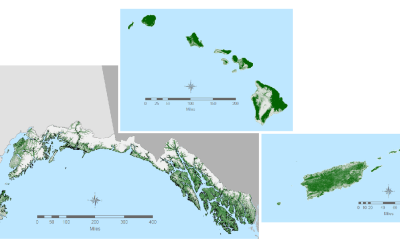
The RCMAP product suite includes 10 components: annual herbaceous, bare ground, herbaceous, litter, non-sagebrush shrub, perennial herbaceous, sagebrush, shrub, and tree and shrub height. Data characterize the percentage of each 30-meter pixel in the Western United States covered by each component for each year from 1985-2025 - providing change information for 41 years.
Several enhancements were made to the RCMAP process relative to prior generations. 1) The training database was expanded by incorporating new observations from the BLM Analysis Inventory and Monitoring dataset, Global Biodiversity Information Facility observations of sagebrush and various invasive grass species, data from central Idaho (Sorrentino et al. In Prep), Uncrewed Aerial Vehicle (UAV) data for Western South Dakota (Johnston et al. 2025), and additional Landsat scale observations collected by RCMAP. 2) 10 new high-resolution training sites were added in the Great Plains. 3) Enhanced noise filtering post-processing using the Savitsky-Golay filter, and 4) integration of Exotic Annual Grass products into the RCMAP hierarchy.
We assess the temporal patterns in each RCMAP component with two approaches, 1) linear trends and 2) a breaks and stable states method with a temporal moving window based on structural change at the pixel level. Linear trend products include Theil-Sen slope, which features improved estimation of trend given outliers compared to the least squares method. The slope represents the average percent cover change per year over the times-series. The structural change method partitions the time-series into segments of similar slope values, with statistically significant break-points indicating perturbations to the prior trajectory. The break point trends analysis suite relies on structural break methods, resulting in the identification of the number and timing of breaks in the time-series, and the significance of each segment. We produce the following statistics: 1) for each component, each year, the presence/absence of breaks, 2) the slope, p-value, and standard error of the segment occurring in each year, 3) the overall model R2 (quality of model fit to the temporal profile), and 4) an index, Total Change Intensity. This index reflects the total amount of change occurring across components in that pixel.
Break Point Presence/Absence in Each Year
Presence/absence of structural breaks in each component each year.
Slope of Segment in Each Year
Slope of structural breaks segment, given in units of % change/year × 100.
Break Point Count
Number of structural breaks observed in the time-series.
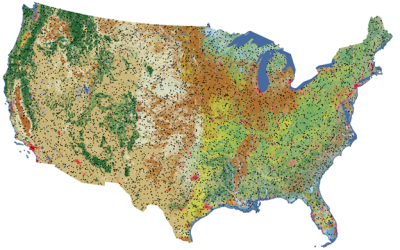
Total Change Intensity Index
Total Change Intensity is a derivative index, designed to highlight the total amount of change across primary components (shrub, bare ground, litter, tree, and herbaceous). Change is reflective of the slope values from the structural change analysis. Values are indexed so that the maximum observed change across all components and no change equaled 100 and 0, respectively.
Year of Most Recent Break
Year of most recent break in the time-series for each component.
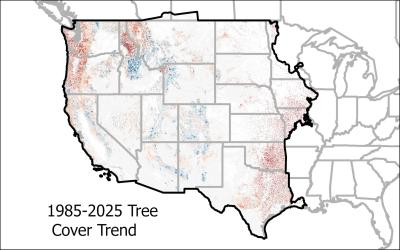
Slope of Linear Model
Theil-Sen slope of linear trends model, given in units of % change/year × 100.
For more information, see this Video describing the basics on RCMAP data and data access and Video on Visualizing Rangeland Change with RCMAP Data
Preferred Citation:
Rigge, M., Bunde, B., and Postma, K., 2026, Rangeland Condition Monitoring Assessment and Projection (RCMAP) Fractional Component Time-Series Across Western North America from 1985-2025: U.S. Geological Survey data release, https://doi.org/10.5066/P138CYEL.
Related Citations:
Rigge, M., Case, M.F., Shaff, S.E., Ellsworth, L., Bunde, B. and Postma, K., 2025. Correspondence Between Satellite-Derived and Long-Term Field Observations of Vegetation Cover at Great Basin Experimental Treatments. Rangeland Ecology & Management, 103, pp.341-355.
Rigge, M., Bunde, B., McCord, S.E., Harrison, G., Assal, T.J. and Smith, J.L., 2025. Spatial Scale Dependence of Error in Fractional Component Cover Maps. Rangeland Ecology & Management, 99, pp.77-87.
Rigge, M.B., Bunde, B., Postma, K., Oliver, S., and Mueller, C., 2024, Application of normalized radar backscatter and hyperspectral data to augment rangeland vegetation fractional classification: Remote Sensing, v. 16, no. 13, article 2315, at https://doi.org/10.3390/rs16132315.
Shi, H., Rigge, M., Postma, K., and Bunde, B. 2022. Trends analysis of rangeland condition monitoring assessment and projection (RCMAP) fractional component time series (1985-2020). GIScience & Remote Sensing. 59: 1243-1265.
Rigge, M.B., Homer, C.G., Cleeves, L., Meyer, D.K., Bunde, B., Shi, H., Xian, G., Schell, S., and Bobo, M., 2020, Quantifying western U.S. rangelands as fractional components with multi-resolution remote sensing and in situ data: Remote Sensing, v. 12, no. 3, article 412, at https://doi.org/10.3390/rs12030412.
Shi, H., Homer, C.G., Rigge, M.B., Postma, K., and Xian, G., 2020, Analyzing vegetation change in a sagebrush ecosystem using long‐term field observations and Landsat imagery in Wyoming: Ecosphere, v. 11, no. 12, article e03311, at https://doi.org/10.1002/ecs2.3311.
Rigge, M., H. Shi, C. Homer, P. Danielson, and B. Granneman. 2019. Long-term trajectories of fractional component change in the Northern Great Basin, USA. Ecosphere: e02762.
For more information on the RCMAP project see: https://www.usgs.gov/centers/eros/science/rangeland-condition-monitoring-assessment-and-projection-rcmap
For additional information on RCMAP product accuracy variation by ecoregion, cover value, and spatial scale, see here