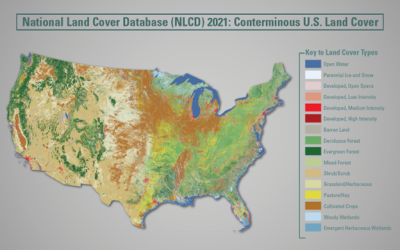
Data
Use the interface below to filter and download available NLCD products. Click (here) for NLCD Science Research Products which offer more comprehensive delineation of shrub and grass classes and information about change disturbance. For access to dynamic MRLC viewer applications and tools, click (here).
Dataset Type
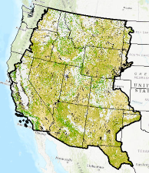
Region
Time Period
Tree Canopy
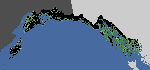
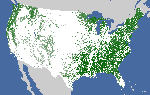
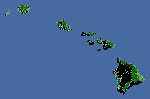
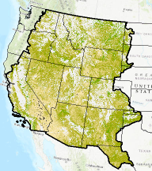
NLCD tree canopy cover geospatial datasets with spatial resolutions of 30 m are produced by the USDA Forest Service. Tree canopy cover is derived from multi-spectral satellite imagery and other available ground and ancillary information. Tree canopy products for the period 2011-2021 are available for the conterminous United States, and by summer 2023, they will also cover coastal south east Alaska, Hawaii, Puerto Rico, and U.S. Virgin Islands. (Read More)


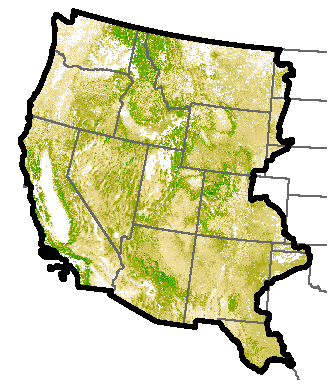
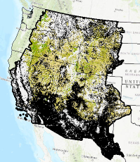
RCMAP – Basemap (2016)
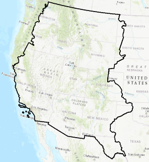
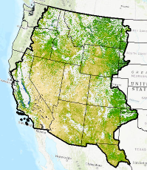
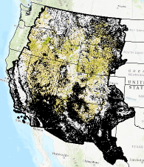
RCMAP base component products characterize the percentage of each 30-meter pixel in the Western United States covered by shrub, herbaceous, bare ground, litter, sagebrush, big sagebrush and annual herbaceous, along with estimating shrub height and sagebrush height. These products have been produced by USGS in collaboration with the Bureau of Land Management. Component products are designed to be used individually or combined to support a broad variety of applications. Please note these new Revised (071520) rangeland products will differ from the first generation of circa 2016 fractional cover maps, a more aggressive masking of tree canopy cover was applied to each rangeland component. Specifically, we have lowered the tree canopy cover threshold for exclusion from 40 to 25%. For pixels with 1-25% tree canopy cover we ensured that our primary components (shrub, herbaceous, litter, and bare ground) cover summed to 100% when added with the tree canopy. And, for the secondary components (sagebrush, big sagebrush, sagebrush height and shrub height) we reconciled to the primary component (shrub), excluding any pinyon-juniper woodlands. (Read More)


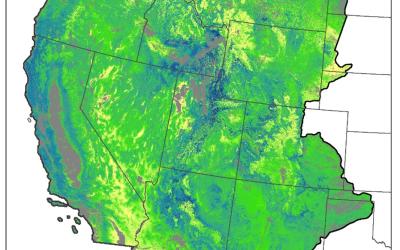
RCMAP - Future Projections - 2020s, 2050s, and 2080s
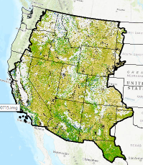
RCMAP projected cover products characterize the fractional (i.e., percentage) cover of shrub, herbaceous, bare ground, litter, sagebrush, tree, and annual herbaceous in each 30-meter pixel in the Western United States. Projected data include three time periods (2020s, 2050s, and 2080s) and two climate scenarios (Representative Concentration Pathways [RCP] 4.5 and 8.5). Component cover were harmonized so that the sum of bare ground, shrub, herbaceous, tree, and litter cover adds to ~100% and secondary components sagebrush and annual herbaceous cover were harmonized to their respective primary components of shrub and herbaceous cover, (so their cover could not be greater than their primary component). These products have been produced by USGS in collaboration with the Bureau of Land Management. Component products are designed to be used individually or combined to support a broad variety of applications. Data are packaged by time-period and climate scenarios (six). Additionally, for comparison to reference conditions, a scenario based on 1991-2020 climate normal is available. (Read More)