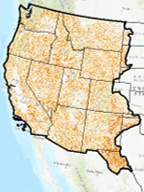
Urban Imperviousness
NLCD imperviousness products represent urban impervious surfaces as a percentage of developed surface over every 30-meter pixel in the United States. The NLCD 2021 release is update based, so the Impervious Surface products released in 2019 are unchanged and can be used directly with NLCD 2021.This update provides integrated analysis throughout all dates and includes a matching impervious surface descriptor layer. This descriptor layer identifies types of roads, wind tower sites, building locations, and energy production sites to allow a deeper analysis of developed features. No new imperviousness products for Alaska, Hawaii and Puerto Rico are available for NLCD 2021. (Read More)
NLCD Imperviousness (CONUS) All Years
CONUS
| 2021, 2019, 2016, 2013, 2011, 2008, 2006, 2004, 2001
NLCD 2019 Percent Developed Imperviousness (CONUS)
CONUS
| 2019
NLCD 2019 Developed Imperviousness Descriptor (CONUS)
CONUS
| 2019
NLCD 2016 Percent Developed Imperviousness (CONUS)
CONUS
| 2016
NLCD 2016 Developed Imperviousness Descriptor (CONUS)
CONUS
| 2016
NLCD 2011 Percent Developed Imperviousness (CONUS)
CONUS
| 2011
NLCD 2011 Percent Developed Imperviousness Zone 8 (ALASKA)
Alaska
| 2011
NLCD 2011 Developed Imperviousness Descriptor (CONUS)
CONUS
| 2011
NLCD 2006 Percent Developed Imperviousness (CONUS)
CONUS
| 2006
NLCD 2006 Developed Imperviousness Descriptor (CONUS)
CONUS
| 2006
NLCD 2001 Percent Developed Imperviousness (CONUS)
CONUS
| 2001
NLCD 2001 Developed Imperviousness Descriptor (CONUS)
CONUS
| 2001
NLCD 2001 to 2011 Developed Imperviousness Zone 8 Change (ALASKA)
Alaska
| 2001, 2011
NLCD 2001 Percent Developed Imperviousness Zone 8 (ALASKA)
Alaska
| 2001
NLCD 2001 Percent Developed Impervious (HAWAII)
Islands & Territories
| 2001
NLCD 2021 Developed Imperviousness Descriptor (CONUS)
CONUS
| 2021
NLCD 2021 Percent Developed Imperviousness (CONUS)
CONUS
| 2021
NLCD 2016 Percent Developed Imperviousness Zone 8 (ALASKA)
Alaska
| 2016
NLCD 2016 Developed Impervious Descriptor Zone 8 (ALASKA)
Alaska
| 2016
NLCD 2016 Developed Urban Descriptor (ALASKA)
Alaska
| 2016
NLCD 2013 Developed Imperviousness (CONUS)
CONUS
| 2013
NLCD 2013 Developed Imperviousness Descriptor (CONUS)
CONUS
| 2013
NLCD 2011 to 2016 Developed Imperviousness Zone 8 Change (ALASKA)
Alaska
| 2011, 2016
NLCD 2011 Developed Impervious Descriptor Zone 8 (ALASKA)
Alaska
| 2011
NLCD 2011 Developed Urban Descriptor (ALASKA)
Alaska
| 2011
NLCD 2008 Percent Developed Imperviousness (CONUS)
CONUS
| 2008
NLCD 2008 Developed Imperviousness Descriptor (CONUS)
CONUS
| 2008
NLCD 2004 Percent Developed Imperviousness (CONUS)
CONUS
| 2004
NLCD 2004 Developed Imperviousness Descriptor (CONUS)
CONUS
| 2004
NLCD 2001 Percent Developed Imperviousness (PUERTO RICO)
Islands & Territories
| 2001
NLCD 2001 to 2016 Developed Imperviousness Zone 8 Change (ALASKA)
Alaska
| 2001, 2016
NLCD 2001 Developed Impervious Descriptor Zone 8 (ALASKA)
Alaska
| 2001
NLCD 2001 Developed Urban Descriptor (ALASKA)
Alaska
| 2001
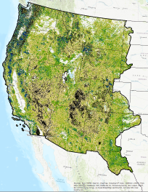
Tree Canopy
NLCD tree canopy cover geospatial datasets with spatial resolutions of 30 m are produced by the USDA Forest Service. Tree canopy cover is derived from multi-spectral satellite imagery and other available ground and ancillary information. Tree canopy products for the period 2011-2021 are available for the conterminous United States, and by summer 2023, they will also cover coastal south east Alaska, Hawaii, Puerto Rico, and U.S. Virgin Islands. (Read More)
NLCD 2021 USFS Tree Canopy Cover (CONUS)
CONUS
| 2021
NLCD 2021 USFS Tree Canopy Cover (HAWAII)
Islands & Territories
| 2021
NLCD 2021 USFS Tree Canopy Cover (ALASKA)
Alaska
| 2021
NLCD 2021 USFS Tree Canopy Cover (PUERTO RICO & U.S. VIRGIN ISLANDS)
Islands & Territories
| 2021
NLCD 2020 USFS Tree Canopy Cover (CONUS)
CONUS
| 2020
NLCD 2020 USFS Tree Canopy Cover (HAWAII)
Islands & Territories
| 2020
NLCD 2020 USFS Tree Canopy Cover (ALASKA)
Alaska
| 2020
NLCD 2020 USFS Tree Canopy Cover (PUERTO RICO & U.S. VIRGIN ISLANDS)
Islands & Territories
| 2020
NLCD 2019 USFS Tree Canopy Cover (CONUS)
CONUS
| 2019
NLCD 2019 USFS Tree Canopy Cover (HAWAII)
Islands & Territories
| 2019
NLCD 2019 USFS Tree Canopy Cover (ALASKA)
Alaska
| 2019
NLCD 2019 USFS Tree Canopy Cover (PUERTO RICO & U.S. VIRGIN ISLANDS)
Islands & Territories
| 2019
NLCD 2018 USFS Tree Canopy Cover (CONUS)
CONUS
| 2018
NLCD 2018 USFS Tree Canopy Cover (HAWAII)
Islands & Territories
| 2018
NLCD 2018 USFS Tree Canopy Cover (ALASKA)
Alaska
| 2018
NLCD 2018 USFS Tree Canopy Cover (PUERTO RICO & U.S. VIRGIN ISLANDS)
Islands & Territories
| 2018
NLCD 2017 USFS Tree Canopy Cover (CONUS)
CONUS
| 2017
NLCD 2017 USFS Tree Canopy Cover (HAWAII)
Islands & Territories
| 2017
NLCD 2017 USFS Tree Canopy Cover (ALASKA)
Alaska
| 2017
NLCD 2017 USFS Tree Canopy Cover (PUERTO RICO & U.S. VIRGIN ISLANDS)
Islands & Territories
| 2017
NLCD 2016 USFS Tree Canopy Cover (ALASKA)
Alaska
| 2016
NLCD 2016 USFS Tree Canopy Cover (HAWAII)
Islands & Territories
| 2016
NLCD 2016 USFS Tree Canopy Cover (PUERTO RICO & U.S. VIRGIN ISLANDS)
Islands & Territories
| 2016
NLCD 2016 USFS Tree Canopy Cover (CONUS)
CONUS
| 2016
NLCD 2015 USFS Tree Canopy Cover (CONUS)
CONUS
| 2015
NLCD 2015 USFS Tree Canopy Cover (HAWAII)
Islands & Territories
| 2015
NLCD 2015 USFS Tree Canopy Cover (ALASKA)
Alaska
| 2015
NLCD 2015 USFS Tree Canopy Cover (PUERTO RICO & U.S. VIRGIN ISLANDS)
Islands & Territories
| 2015
NLCD 2014 USFS Tree Canopy Cover (CONUS)
CONUS
| 2014
NLCD 2014 USFS Tree Canopy Cover (HAWAII)
Islands & Territories
| 2014
NLCD 2014 USFS Tree Canopy Cover (ALASKA)
Alaska
| 2014
NLCD 2014 USFS Tree Canopy Cover (PUERTO RICO & U.S. VIRGIN ISLANDS)
Islands & Territories
| 2014
NLCD 2013 USFS Tree Canopy Cover (CONUS)
CONUS
| 2013
NLCD 2013 USFS Tree Canopy Cover (HAWAII)
Islands & Territories
| 2013
NLCD 2013 USFS Tree Canopy Cover (ALASKA)
Alaska
| 2013
NLCD 2013 USFS Tree Canopy Cover (PUERTO RICO & U.S. VIRGIN ISLANDS)
Islands & Territories
| 2013
NLCD 2012 USFS Tree Canopy Cover (CONUS)
CONUS
| 2012
NLCD 2012 USFS Tree Canopy Cover (HAWAII)
Islands & Territories
| 2012
NLCD 2012 USFS Tree Canopy Cover (ALASKA)
Alaska
| 2012
NLCD 2012 USFS Tree Canopy Cover (PUERTO RICO & U.S. VIRGIN ISLANDS)
Islands & Territories
| 2012
NLCD 2011 USFS Tree Canopy Cover (CONUS)
CONUS
| 2011
NLCD 2011 USFS Tree Canopy Cover (HAWAII)
Islands & Territories
| 2011
NLCD 2011 USFS Tree Canopy Cover (ALASKA)
Alaska
| 2011
NLCD 2011 USFS Tree Canopy Cover (PUERTO RICO & U.S. VIRGIN ISLANDS)
Islands & Territories
| 2011
NLCD ALL USFS Tree Canopy Cover (CONUS)
CONUS
| 2011-2021
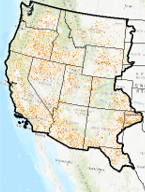
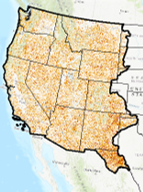
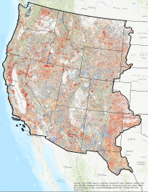
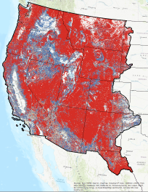
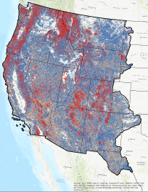
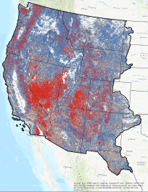
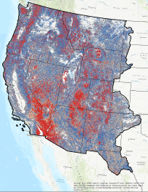
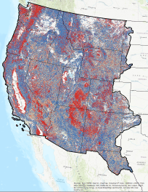
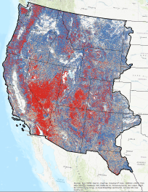
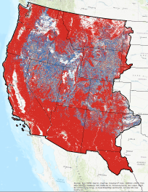
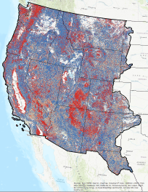
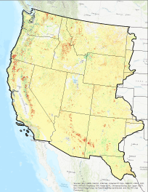
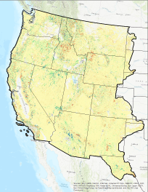
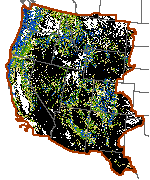
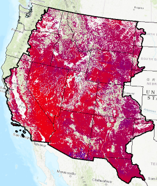
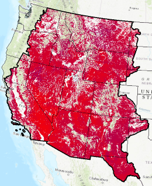
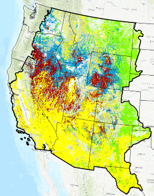
RCMAP - Time-Series - Trends
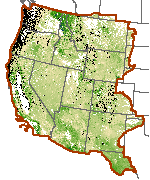
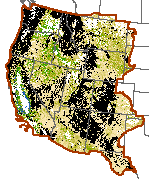
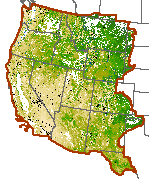
The RCMAP product suite includes 10 components: annual herbaceous, bare ground, herbaceous, litter, non-sagebrush shrub, perennial herbaceous, sagebrush, shrub, tree, and shrub height. Data characterize the percentage of each 30-meter pixel in the Western United States covered by each component for each year from 1985-2023 - providing change information for 39 years. (Read More)
Break Point Presence/Absence in Each Year Annual Herbaceous
Western U.S.
| Time Series Trends
Break Point Presence/Absence in Each Year Bare Ground
Western U.S.
| Time Series Trends
Break Point Presence/Absence in Each Year Herbaceous
Western U.S.
| Time Series Trends
Break Point Presence/Absence in Each Year Litter
Western U.S.
| Time Series Trends
Break Point Presence/Absence in Each Year Non Sagebrush Shrub
Western U.S.
| Time Series Trends
Break Point Presence/Absence in Each Year Perennial Herbaceous
Western U.S.
| Time Series Trends
Slope of Segment in Each Year Shrub
Western U.S.
| Time Series Trends
Break Point Presence/Absence in Each Year Sagebrush
Western U.S.
| Time Series Trends
Break Point Presence/Absence in Each Year Shrub
Western U.S.
| Time Series Trends
Break Point Presence/Absence in Each Year Tree
Western U.S.
| Time Series Trends
Break Point Count
Western U.S.
| Time Series Trends
P-Value of Segment in Each Year Annual Herbaceous
Western U.S.
| Time Series Trends
P-Value of Segment in Each Year Bare Ground
Western U.S.
| Time Series Trends
P-Value of Segment in Each Year Herbaceous
Western U.S.
| Time Series Trends
P-Value of Segment in Each Year Litter
Western U.S.
| Time Series Trends
P-Value of Segment in Each Year Non Sagebrush Shrub
Western U.S.
| Time Series Trends
P-Value of Segment in Each Year Perennial Herbaceous
Western U.S.
| Time Series Trends
P-Value of Segment in Each Year Sagebrush
Western U.S.
| Time Series Trends
P-Value of Segment in Each Year Shrub
Western U.S.
| Time Series Trends
P-Value of Segment in Each Year Tree
Western U.S.
| Time Series Trends
P-Value of Linear Model
Western U.S.
| Time Series Trends
Slope of Linear Model
Western U.S.
| Time Series Trends
Slope of Segment in Each Year Annual Herbaceous
Western U.S.
| Time Series Trends
Slope of Segment in Each Year Bare Ground
Western U.S.
| Time Series Trends
Slope of Segment in Each Year Herbaceous
Western U.S.
| Time Series Trends
Slope of Segment in Each Year Litter
Western U.S.
| Time Series Trends
Slope of Segment in Each Year Non Sagebrush Shrub
Western U.S.
| Time Series Trends
Slope of Segment in Each Year Perennial Herbaceous
Western U.S.
| Time Series Trends
Slope of Segment in Each Year Sagebrush
Western U.S.
| Time Series Trends
Slope of Segment in Each Year Tree
Western U.S.
| Time Series Trends
Total Change Intensity Index
Western U.S.
| Time Series Trends
Year of Most Recent Break
Western U.S.
| Time Series Trends
Break Point Presence/Absence in Each Year Shrub Height
Western U.S.
| Time Series Trends
Slope of Segment in Each Year Shrub Height
Western U.S.
| Time Series Trends
P-Value of Segment in Each Year Shrub Height
Western U.S.
| Time Series Trends
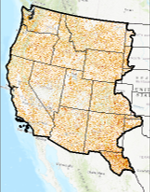
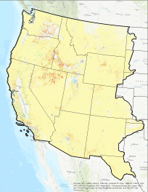
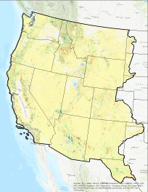
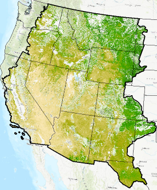
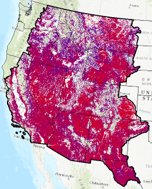
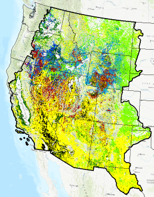
RCMAP - Time-Series - Cover
V5 RCMAP Factsheet.pdf2.14 MB
Maximizing Accuracy of Rangeland Data- RCMAP article April 2024
The RCMAP product suite includes 10 components: annual herbaceous, bare ground, herbaceous, litter, non-sagebrush shrub, perennial herbaceous, sagebrush, shrub, tree, and shrub height. Data characterize the percentage of each 30-meter pixel in the Western United States covered by each component for each year from 1985-2023 - providing change information for 39 years. Because of file size limitations, individual years of component cover data are packaged in three time intervals including 1985-1996, 1997-2008, and 2009-2023. Perennial herb and non-sagebrush shrub are derivatives of herbaceous and annual herbaceous cover, and shrub and sagebrush cover, respectively. (Read More)
RCMAP Annual Herbaceous Cover
Western U.S.
| 2009-2023
RCMAP Shrub Cover
Western U.S.
| 2009-2023
RCMAP Shrub Cover
Western U.S.
| 1997-2008
RCMAP Shrub Cover
Western U.S.
| 1985-1996
RCMAP Sagebrush Cover
Western U.S.
| 2009-2023
RCMAP Sagebrush Cover
Western U.S.
| 1997-2008
RCMAP Sagebrush Cover
Western U.S.
| 1985-1996
RCMAP Litter Cover
Western U.S.
| 2009-2023
RCMAP Litter Cover
Western U.S.
| 1997-2008
RCMAP Litter Cover
Western U.S.
| 1985-1996
RCMAP Herbaceous Cover
Western U.S.
| 2009-2023
RCMAP Herbaceous Cover
Western U.S.
| 1997-2008
RCMAP Herbaceous Cover
Western U.S.
| 1985-1996
RCMAP Bare Ground Cover
Western U.S.
| 2009-2023
RCMAP Bare Ground Cover
Western U.S.
| 1997-2008
RCMAP Bare Ground Cover
Western U.S.
| 1985-1996
RCMAP Non-sagebrush Shrub Cover
Western U.S.
| 2009-2023
RCMAP Perennial Herbaceous Cover
Western U.S.
| 2009-2023
RCMAP Tree Cover
Western U.S.
| 2009-2023
RCMAP Shrub Height
Western U.S.
| 2009-2023
RCMAP Annual Herbaceous Cover
Western U.S.
| 1997-2008
RCMAP Non-sagebrush Shrub Cover
Western U.S.
| 1997-2008
RCMAP Perennial Herbaceous Cover
Western U.S.
| 1997-2008
RCMAP Tree Cover
Western U.S.
| 1997-2008
RCMAP Shrub Height
Western U.S.
| 1997-2008
RCMAP Annual Herbaceous Cover
Western U.S.
| 1985-1996
RCMAP Non-sagebrush Shrub Cover
Western U.S.
| 1985-1996
RCMAP Perennial Herbaceous Cover
Western U.S.
| 1985-1996
RCMAP Tree Cover
Western U.S.
| 1985-1996
RCMAP Shrub Height
Western U.S.
| 1985-1996
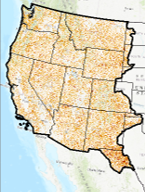
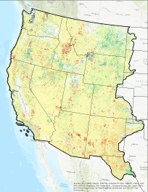
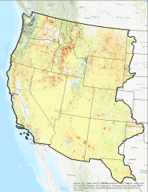
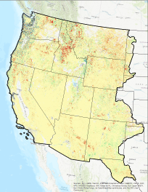
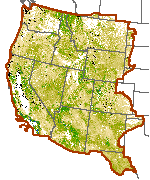
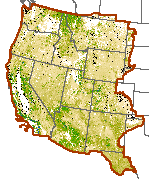
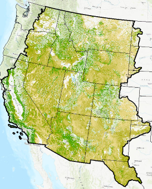
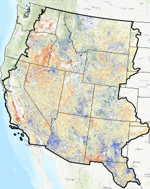
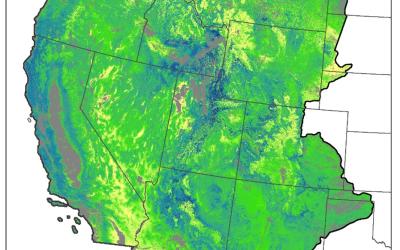
Ecological Potential
Rangeland Ecological Potential - Component Cover, Cover Departure, and Vegetation States.
Ecological Potential rangeland fractional cover data products represent the potential cover given the most productive, least disturbed, portion of the 1985-2020 Landsat archive. Models used to predict Ecological Potential cover were trained on ecologically intact sites where annual herbaceous cover is low, no known disturbance or land treatment has occurred over the study period, and bare ground cover is relatively lower than expectations (Read More)
Ecological Potential Bare Ground Cover
Western U.S.
Ecological Potential Sagebrush Cover
Western U.S.
Ecological Potential Perennial Herbaceous Cover
Western U.S.
Ecological Potential Litter Cover
Western U.S.
Ecological Potential Shrub Cover
Western U.S.
Percent Error for Ecological Potential Bare Ground
Western U.S.
Percent Error for Ecological Potential Sagebrush
Western U.S.
Percent Error for Ecological Potential Perennial Herbaceous
Western U.S.
Percent Error for Ecological Potential Litter
Western U.S.
Percent Error for Ecological Potential Shrub
Western U.S.
Departure of Bare Ground Cover
Western U.S.
Departure of Sagebrush Cover
Western U.S.
Departure of Perennial Herbaceous Cover
Western U.S.
Departure of Litter Cover
Western U.S.
Departure of Shrub Cover
Western U.S.
Ecological Potential Vegetation State
Western U.S.
2018 Vegetation State
Western U.S.